目次
概要
matplotlib の pyplot.clabel() で pyplot.contour() で作成する等高線にラベルをつける方法について解説します。
pyplot.clabel
matplotlib.pyplot.clabel(CS, levels=None, **kwargs)引数
| 名前 | 型 | デフォルト値 |
|---|---|---|
| CS | ContourSet instance | |
| ラベルを付ける ContourSet オブジェクト | ||
| levels | array-like | None |
| ラベルを付ける必要がある等高線のリスト。リストは CS.level のサブセットである必要があります。指定しない場合は、すべての等高線がラベル付けされます。 | ||
pyplot.contour() の返り値である ContourSet オブジェクトを pyplot.clabel() に渡すことでラベルが付けられます。
In [1]:
import numpy as np
from matplotlib import pyplot as plt
from mpl_toolkits.mplot3d import Axes3D


X, Y = np.mgrid[-10:11, -10:11]
Z = X ** 2 + Y ** 2 + X * Y

fig, ax = plt.subplots(figsize=(7, 7))
cs = ax.contour(X, Y, Z)
ax.clabel(cs)

plt.show()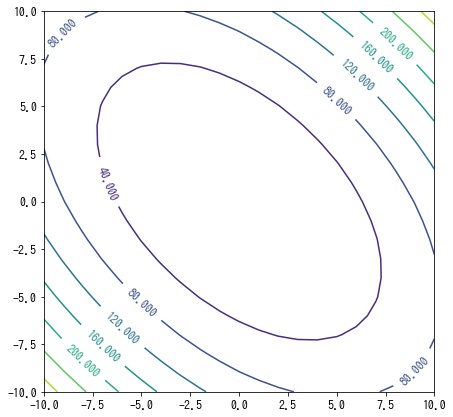
ラベルを表示する等高線を選択する
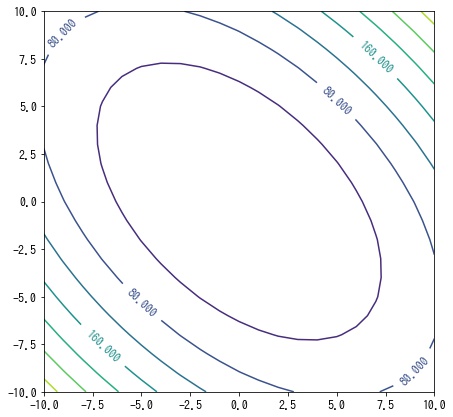
デフォルトではすべての等高線にラベルが表示されますが、第2引数にラベルを表示する等高線のリストを渡すことで、その等高線にだけラベルが表示されます。
すべての等高線の値はpyplot.contour() の返り値である ContourSet オブジェクトの ContourSet.levels で確認できるので、その中からラベルを表示する等高線を選びます。
In [2]:
import numpy as np
from matplotlib import pyplot as plt
from mpl_toolkits.mplot3d import Axes3D


X, Y = np.mgrid[-10:11, -10:11]
Z = X ** 2 + Y ** 2 + X * Y

fig, ax = plt.subplots(figsize=(7, 7))
cs = ax.contour(X, Y, Z)
print(cs.levels)

# 2つおきに表示する。
ax.clabel(cs, cs.levels[::2])

plt.show()
[ 0. 40. 80. 120. 160. 200. 240. 280. 320.]
ラベルの色を指定する
colors でラベルの色を指定できます。
1つの色を指定した場合はすべてのラベルは同じ色になります。
In [3]:
import numpy as np
from matplotlib import pyplot as plt
from mpl_toolkits.mplot3d import Axes3D


X, Y = np.mgrid[-10:11, -10:11]
Z = X ** 2 + Y ** 2 + X * Y

fig, ax = plt.subplots(figsize=(7, 7))
cs = ax.contour(X, Y, Z)
ax.clabel(cs, colors="black")

plt.show()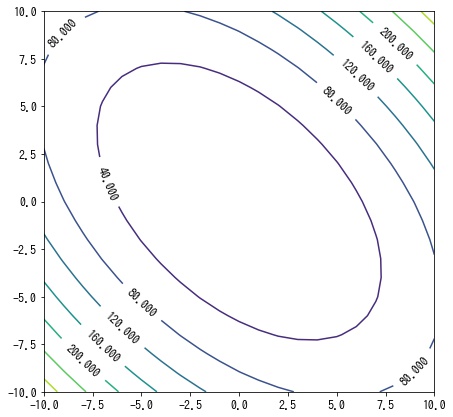
描画する等高線のラベル数と同じ数の色の一覧を指定することで、等高線のラベルごとに色を指定できます。
In [4]:
import numpy as np
from matplotlib import pyplot as plt
from mpl_toolkits.mplot3d import Axes3D


X, Y = np.mgrid[-10:11, -10:11]
Z = X ** 2 + Y ** 2 + X * Y

# 各等高線の色をランダムに作成する。
np.random.seed(42)
colors = np.random.rand(len(cs.levels), 3)

fig, ax = plt.subplots(figsize=(7, 7))
cs = ax.contour(X, Y, Z)
ax.clabel(cs, colors=colors)

plt.show()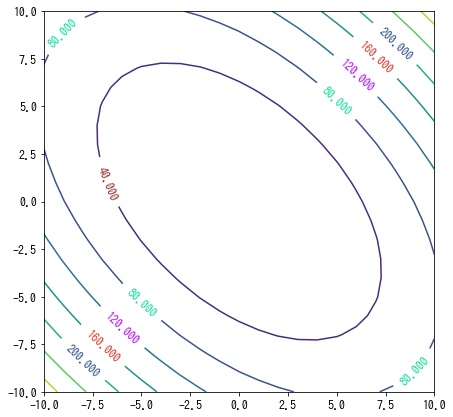
ラベルと等高線間の余白を設定する
inline=True の場合、ラベルの周りは等高線を表示しません。その場合、inline_spacing でその幅を指定できます。
In [5]:
import numpy as np
from matplotlib import pyplot as plt
from mpl_toolkits.mplot3d import Axes3D


X, Y = np.mgrid[-10:11, -10:11]
Z = X ** 2 + Y ** 2 + X * Y

fig, [ax1, ax2] = plt.subplots(1, 2, figsize=(10, 5))

cs = ax1.contour(X, Y, Z)
ax1.set_title("inline=True")
ax1.clabel(cs, inline=True, inline_spacing=5)

cs = ax2.contour(X, Y, Z)
ax2.set_title("inline=False")
ax2.clabel(cs, inline=False)

plt.show()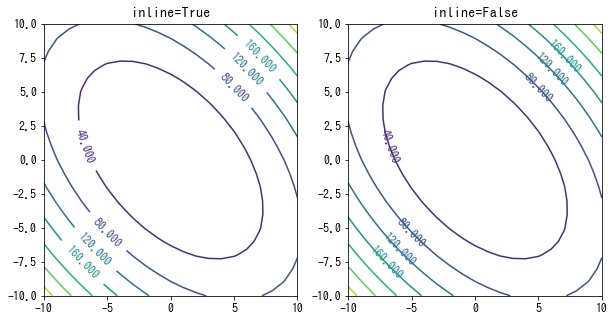


コメント