目次
概要
matplotlib で円、長方形、多角形などの図形を描画する方法について解説します。
図形の種類
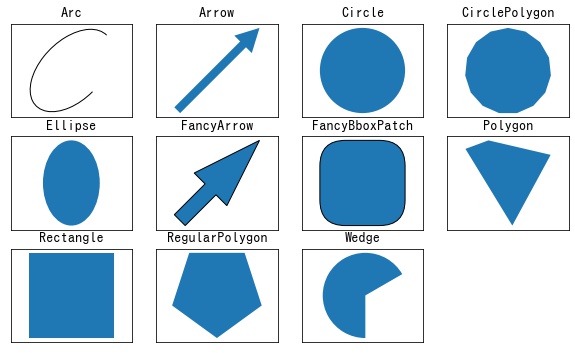
matplotlib.patches では次の種類の図形が提供されています。
- patches.Arc: 弧
- patches.Arrow: 矢印
- patches.Circle: 円
- patches.CirclePolygon: 多角形で近似した円
- patches.Ellipse: 楕円
- patches.FancyArrow: カスタマイズ可能な矢印
- patches.FancyBboxPatch: カスタマイズ可能な長方形
- patches.Polygon: ポリゴン
- patches.Rectangle: 長方形
- patches.RegularPolygo: 正多角形
- patches.Wedge: くさび
patches.Arc (弧)
class matplotlib.patches.Arc(xy, width, height, angle=0.0, theta1=0.0, theta2=360.0, **kwargs)引数
| 名前 | 型 | デフォルト値 |
|---|---|---|
| xy | (float, float) | |
| 楕円の中心。 | ||
| width | float | |
| 横軸の長さ。 | ||
| height | float | |
| 縦軸の長さ。 | ||
| angle | float | 0.0 |
| 楕円の回転角度を度で指定します。(反時計回り)。 | ||
| theta1, theta2 | float, default: 0, 360 | |
| 円弧の開始角度と終了角度を度で指定します。これらの値は angle に対する相対的なもので、例えば angle = 45 で theta1 = 90 の場合、 絶対的な開始角度は 135 となります。デフォルトでは、tehta1 = 0, theta2 = 360、すなわち完全な楕円です。円弧は反時計回りに描かれます。360 以上、または 0 より小さい角度は、入力値 mod 360 を用いて、[0, 360] の範囲内の等価な角度で表現されます。 | ||
In [1]:
from matplotlib import pyplot as plt
from matplotlib import patches

patch = patches.Arc(xy=(1, 1), width=2, height=1, angle=45, theta1=0, theta2=270)

fig, ax = plt.subplots()
ax.add_patch(patch)
ax.autoscale()
ax.grid()

plt.show()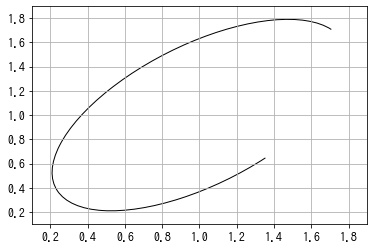
patches.Arrow (矢印)
class matplotlib.patches.Arrow(x, y, dx, dy, width=1.0, **kwargs)引数
| 名前 | 型 | デフォルト値 |
|---|---|---|
| x | float | |
| 矢印の尾のx座標。 | ||
| y | float | |
| 矢印の尾のy座標。 | ||
| dx | float | |
| x 方向の矢印の長さ。 | ||
| dy | float | |
| y 方向の矢印の長さ。 | ||
| width | float, default: 1 | 1.0 |
| 矢印の幅のスケールファクタ。デフォルト値は1で、尾の幅は0.2、頭の幅は0.6です。 | ||
In [2]:
from matplotlib import pyplot as plt
from matplotlib import patches

patch = patches.Arrow(x=0.5, y=0.5, dx=0.2, dy=0.2, width=0.1)

fig, ax = plt.subplots(figsize=(6, 6))
ax.add_patch(patch)
ax.autoscale()
ax.grid()

plt.show()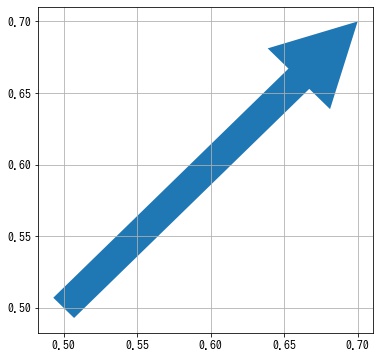
patches.Circle (円)
class matplotlib.patches.Circle(xy, radius=5, **kwargs)引数
| 名前 | 型 | デフォルト値 |
|---|---|---|
| xy | (float, float) | |
| 円の中心。 | ||
| radius | float | |
| 円の半径。 | ||
In [3]:
from matplotlib import pyplot as plt
from matplotlib import patches

patch = patches.Circle(xy=(1, 1), radius=2)

fig, ax = plt.subplots(figsize=(6, 6))
ax.add_patch(patch)
ax.autoscale()
ax.grid()

plt.show()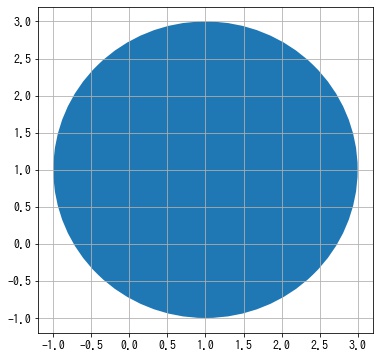
patches.CirclePolygon (多角形で近似した円)
class matplotlib.patches.CirclePolygon(xy, radius=5, resolution=20, **kwargs)引数
| 名前 | 型 | デフォルト値 |
|---|---|---|
| xy | (float, float) | |
| 円の中心。 | ||
| radius | float | |
| 円の半径。 | ||
| resolution | int | |
| 何角形で近似するか。 | ||
In [4]:
from matplotlib import pyplot as plt
from matplotlib import patches

patch = patches.CirclePolygon(xy=(1, 1), radius=2, resolution=10)

fig, ax = plt.subplots(figsize=(6, 6))
ax.add_patch(patch)
ax.autoscale()
ax.grid()

plt.show()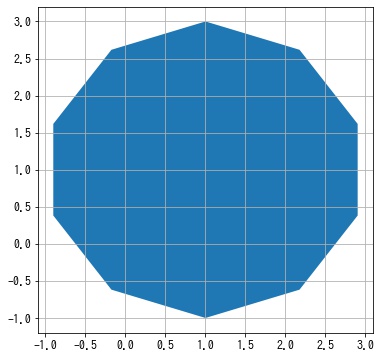
patches.Ellipse (楕円)
class matplotlib.patches.Ellipse(xy, width, height, angle=0, **kwargs)引数
| 名前 | 型 | デフォルト値 |
|---|---|---|
| xy | (float, float) | |
| 楕円の中心。 | ||
| width | float | |
| 横軸の長さ。 | ||
| height | float | |
| 縦軸の長さ。 | ||
| angle | float | 0.0 |
| 楕円の回転角度を度で指定します。(反時計回り) | ||
In [5]:
from matplotlib import pyplot as plt
from matplotlib import patches

patch = patches.Ellipse(xy=(1, 1), width=2, height=1, angle=45)

fig, ax = plt.subplots(figsize=(6, 6))
ax.add_patch(patch)
ax.autoscale()
ax.grid()

plt.show()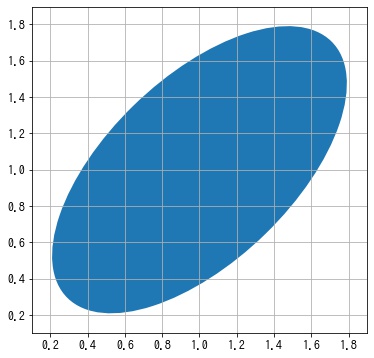
patches.FancyArrow (カスタマイズ可能な矢印)
class matplotlib.patches.FancyArrow(x, y, dx, dy, width=0.001, length_includes_head=False, head_width=None, head_length=None, shape='full', overhang=0, head_starts_at_zero=False, **kwargs)引数
| 名前 | 型 | デフォルト値 |
|---|---|---|
| x | float | |
| 矢印の尾のx座標。 | ||
| y | float | |
| 矢印の尾のy座標。 | ||
| dx | float | |
| x 方向の矢印の長さ。 | ||
| dy | float | |
| y 方向の矢印の長さ。 | ||
| width | float | 0.001 |
| 矢印の尾の幅 | ||
| length_includes_head | bool | False |
| 長さを計算する際に頭を含めるかどうか。 | ||
| head_width | float or None | 3 * width |
| 矢印の頭の幅。 | ||
| head_length | float or None | 1.5 * head_width |
| 矢印の頭の長さ。 | ||
| shape | “full” | {“full”, “left”, “right”} |
| 左半分、右半分、または完全な矢印を描画します。 | ||
| overhang | float | 0 |
| 矢印が後方に掃引される割合(0の場合は三角形を意味します)。負の値または1より大きい値を指定することができます。 | ||
| head_starts_at_zero | bool | False |
| True にすると、ヘッドは座標 0 で終了するのではなく、座標 0 で描画を開始します。 | ||
patches.Arrow と同様ですが、矢印の見た目をより細かく設定できるようになっています。
In [6]:
from matplotlib import pyplot as plt
from matplotlib import patches

patch = patches.FancyArrow(x=1, y=1, dx=3, dy=3, width=1, head_width=4, head_length=3, overhang=0.2)

fig, ax = plt.subplots(figsize=(6, 6))
ax.add_patch(patch)
ax.autoscale()
ax.grid()

plt.show()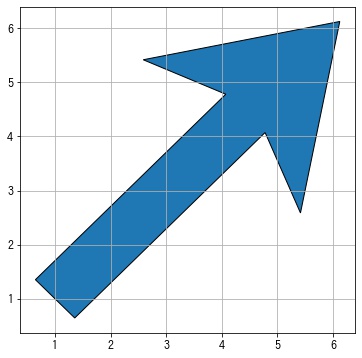
patches.FancyBboxPatch (カスタマイズ可能な長方形)
class matplotlib.patches.FancyBboxPatch(xy, width, height, boxstyle='round', bbox_transmuter=None, mutation_scale=1.0, mutation_aspect=None, **kwargs)引数
| 名前 | 型 | デフォルト値 |
|---|---|---|
| xy | float, float | |
| 矩形の左下の点の座標。 | ||
| width | float | |
| 矩形の幅。 | ||
| height | float | |
| 矩形の高さ。 | ||
| boxstyle | str or matplotlib.patches.BoxStyle | ‘round’ |
| FancyBboxPatch のスタイル。これは BoxStyle のインスタンスか、スタイル名とオプションでカンマ区切りの属性 (例: “Round, pad=0.2”) の文字列のいずれかです。この文字列は BoxStyle オブジェクトを構築するために BoxStyle に渡されます。 | ||
| mutation_scale | float, default: 1 | 1.0 |
| ボックススタイルの属性に適用されるスケーリング係数。 | ||
| mutation_aspect | float | None |
| 矩形の高さは変更前にこの値で絞られ、変更したボックスはその逆数で引き伸ばされます。例えば、これにより、水平方向と垂直方向で異なるパディングが可能になります。 | ||
FancyBboxPatch は Rectangle と似ていますが、長方形の角を丸めたりすることができます。
In [7]:
from matplotlib import pyplot as plt
from matplotlib import patches

patch = patches.FancyBboxPatch(
    xy=(1, 2), width=2, height=3, boxstyle="round4", mutation_scale=2
)

fig, ax = plt.subplots(figsize=(6, 6))
ax.add_patch(patch)
ax.autoscale()
ax.grid()

plt.show()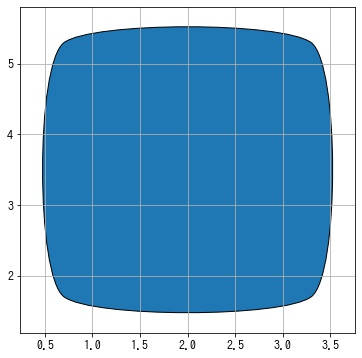
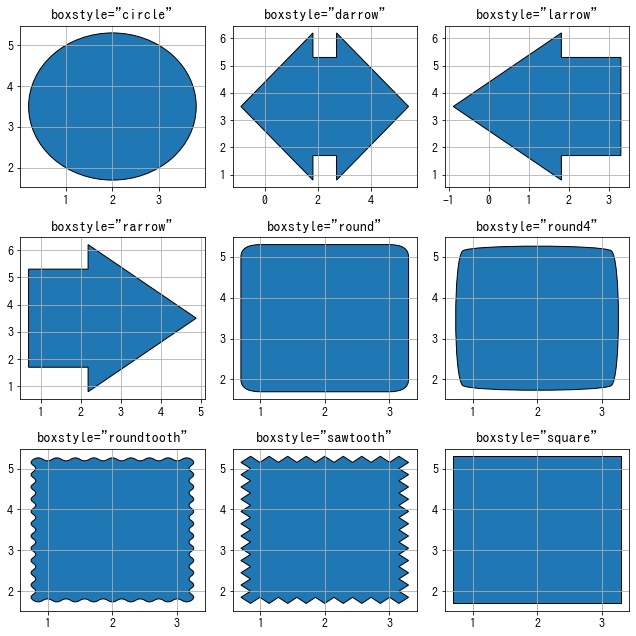
boxstyle には次の値が指定できます。
patches.Rectangle (長方形)
class matplotlib.patches.Rectangle(xy, width, height, angle=0.0, **kwargs)引数
| 名前 | 型 | デフォルト値 |
|---|---|---|
| xy | float, float | |
| 矩形の左下の点の座標。 | ||
| width | float | |
| 矩形の幅。 | ||
| height | float | |
| 矩形の高さ。 | ||
| angle | float | 0 |
In [8]:
from matplotlib import pyplot as plt
from matplotlib import patches

patch = patches.Rectangle(xy=(1, 2), width=2, height=3, angle=45)

fig, ax = plt.subplots(figsize=(6, 6))
ax.add_patch(patch)
ax.autoscale()
ax.grid()

plt.show()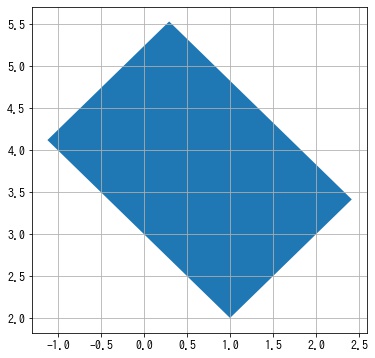
patches.Polygon (ポリゴン)
class matplotlib.patches.Polygon(xy, closed=True, **kwargs)引数
| 名前 | 型 | デフォルト値 |
|---|---|---|
| xy | (n, 2) array | |
| ポリゴンを構成する点。 | ||
| closed | bool | True |
| ポリゴンが閉じているかどうか。 | ||
In [9]:
from matplotlib import pyplot as plt
from matplotlib import patches

points = [[0.55, 0], [1, 0.83], [0.27, 1], [0.0, 0.9], [0.55, 0]]

patch = patches.Polygon(xy=points, closed=True)

fig, ax = plt.subplots(figsize=(6, 6))
ax.add_patch(patch)
ax.autoscale()
ax.grid()

plt.show()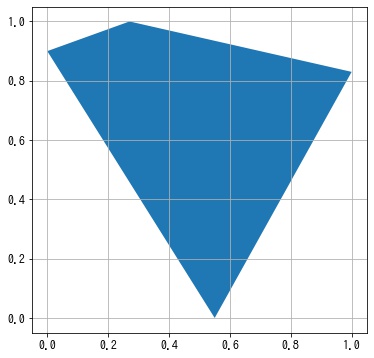
patches.RegularPolygon (正多角形)
class matplotlib.patches.RegularPolygon(xy, numVertices, radius=5, orientation=0, **kwargs)引数
| 名前 | 型 | デフォルト値 |
|---|---|---|
| xy | (float, float) | |
| 中心点。 | ||
| numVertices | int | |
| 頂点数。 | ||
| radius | float | 5 |
| 中心と各頂点との距離。 | ||
| orientation | float | 0 |
| ポリゴンの回転角度をラジアンで指定する。 | ||
In [10]:
from matplotlib import pyplot as plt
from matplotlib import patches

patch = patches.RegularPolygon(
    xy=(0.5, 0.5), numVertices=5, radius=0.3, orientation=np.pi / 4
)

fig, ax = plt.subplots(figsize=(6, 6))
ax.add_patch(patch)
ax.autoscale()
ax.grid()

plt.show()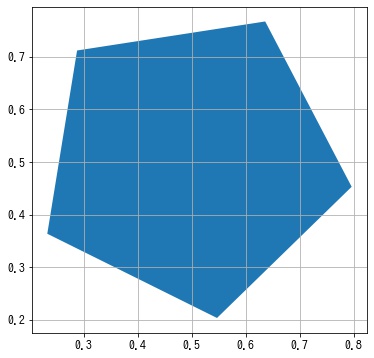
patches.Wedge (くさび)
wedge = mpatches.Wedge(center, r, theta1, theta2, width=None, **kwargs)[source]引数
| 名前 | 型 | デフォルト値 |
|---|---|---|
| center | (float, float) | |
| くさびの中心点。 | ||
| r | float | |
| くさびの半径。 | ||
| theta1, theta2 | float, default: 0, 360 | |
| 円弧の開始角度と終了角度を度で指定します。360 以上、または 0 より小さい角度は、入力値 mod 360 を用いて、[0, 360] の範囲内の等価な角度で表現されます。 | ||
| width | float | None |
| width を指定した場合、r – width から r まで部分的なくさびが描かれます。 | ||
In [11]:
from matplotlib import pyplot as plt
from matplotlib import patches

patch = patches.Wedge(center=(1, 1), r=2, theta1=0, theta2=270, width=1)

fig, ax = plt.subplots(figsize=(6, 6))
ax.add_patch(patch)
ax.autoscale()
ax.grid()

plt.show()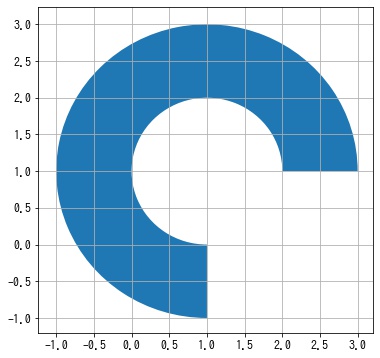


コメント