
目次
概要
matplotlib の axhline, axvline, axhspan, axvspan で水平、垂直な線、帯を描画する方法について解説します。
公式リファレンス
- pyplot.axhline: 水平線を1本引く
- Axes.axhline: 水平線を1本引く
- pyplot.hlines: 水平線を複数本引く
- Axes.hlines: 水平線を複数本引く
- pyplot.axvline: 垂直線を1本引く
- Axes.axvline: 垂直線を1本引く
- pyplot.vlines: 垂直線を複数本引く
- Axes.vlines: 垂直線を複数本引く
- pyplot.axhspan: 水平な帯を作成する
- Axes.axhspan: 水平な帯を作成する
- pyplot.axvspan: 垂直な帯を作成する
- Axes.axvspan: 垂直な帯を作成する
水平な直線または線分を引く
axhline – 水平な直線を1本引く
In [1]:
import numpy as np
from matplotlib import pyplot as plt

fig, ax = plt.subplots()
ax.set_xlim(-1, 1)
ax.set_ylim(-1, 1)
ax.axhline(y=0)

plt.show()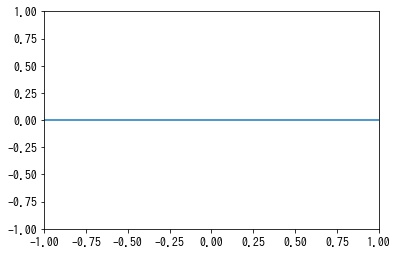
axhline – 水平な線分を1本引く
[xmin, xmax] の範囲で水平な線分を1本引きます。
In [2]:
fig, ax = plt.subplots()
ax.set_xlim(-1, 1)
ax.set_ylim(-1, 1)
ax.axhline(y=0, xmin=0.2, xmax=0.8)

plt.show()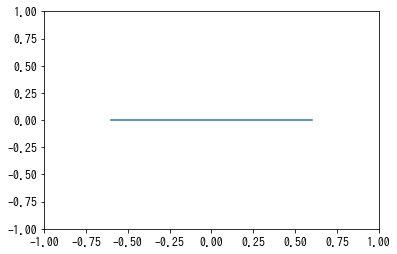
hlines – 水平な線分を複数本引く
In [3]:
fig, ax = plt.subplots()
ax.set_xlim(-1, 1)
ax.set_ylim(-1, 1)
ax.hlines(y=[-0.3, 0, 0.3], xmin=-0.5, xmax=0.5)

plt.show()
垂直線を引く
axvline – 垂直な直線を1本引く
In [4]:
fig, ax = plt.subplots()
ax.set_xlim(-1, 1)
ax.set_ylim(-1, 1)
ax.axvline(x=0)

plt.show()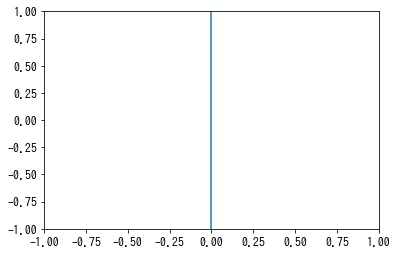
axvline – 垂直な線分を1本引く
[ymin, ymax] の範囲で垂直な線分を1本引きます。
In [5]:
fig, ax = plt.subplots()
ax.set_xlim(-1, 1)
ax.set_ylim(-1, 1)
ax.axvline(x=0, ymin=0.2, ymax=0.8)

plt.show()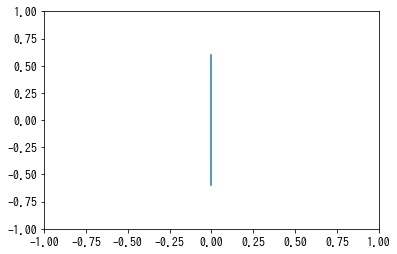
vlines – 垂直線を複数本引く
In [6]:
fig, ax = plt.subplots()
ax.set_xlim(-1, 1)
ax.set_ylim(-1, 1)
ax.vlines(x=[-0.3, 0, 0.3], ymin=-0.5, ymax=0.5)

plt.show()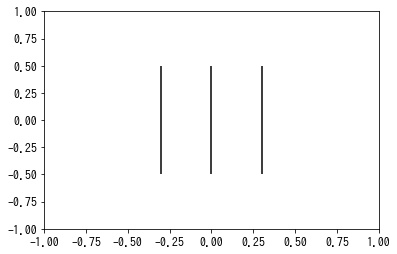
水平な帯を作成する
幅が [ymin, ymax] である水平な帯を作成します。
In [7]:
fig, ax = plt.subplots()
ax.set_xlim(-1, 1)
ax.set_ylim(-1, 1)
ax.axhspan(ymin=-0.1, ymax=0.1)

plt.show()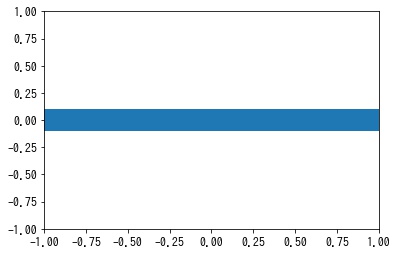
[xmin, xmax] の範囲で水平な帯を作成する
In [8]:
fig, ax = plt.subplots()
ax.set_xlim(-1, 1)
ax.set_ylim(-1, 1)
ax.axhspan(ymin=-0.1, ymax=0.1, xmin=0.2, xmax=0.8)

plt.show()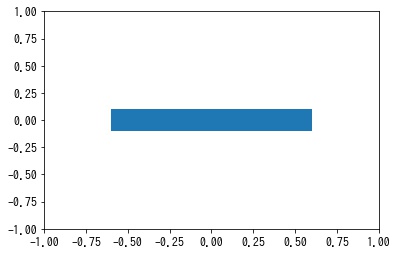
垂直な帯を作成する
幅が [xmin, xmax] である垂直な帯を作成します。
In [9]:
fig, ax = plt.subplots()
ax.set_xlim(-1, 1)
ax.set_ylim(-1, 1)
ax.axvspan(xmin=-0.1, xmax=0.1)

plt.show()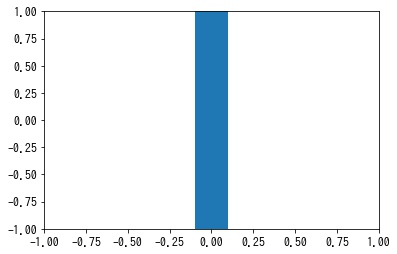
[ymin, ymax] の範囲で垂直な帯を作成します。
In [10]:
fig, ax = plt.subplots()
ax.set_xlim(-1, 1)
ax.set_ylim(-1, 1)
ax.axvspan(xmin=-0.1, xmax=0.1, ymin=0.2, ymax=0.8)

plt.show()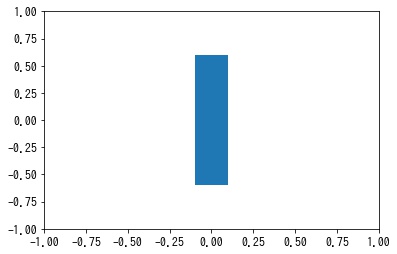
コメント