
目次
概要
matplotlib で x 軸、y 軸のラベル、タイトルを設定する方法を紹介します。
x 軸、y 軸のラベル、タイトル
- pyplot.xlabel: x 軸のラベルを取得または設定する
- pyplot.ylabel: y 軸のラベルを取得または設定する
- axes.Axes.get_xlabel: x 軸のラベルを取得する
- axes.Axes.set_xlabel: x 軸のラベルを設定する
- axes.Axes.get_ylabel: y 軸のラベルを取得する
- axes.Axes.set_ylabel: y 軸のラベルを設定する
- pyplot.title: タイトルを取得または設定する
- axes.Axes.get_title: タイトルを取得する
- axes.Axes.set_title: タイトルを設定する
In [1]:
import numpy as np
from matplotlib import pyplot as plt
np.random.seed(0)
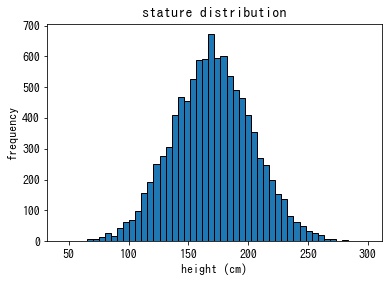
values = 33.73 * np.random.randn(10000) + 170.69
fig, ax = plt.subplots()
# ヒストグラムを描画する。
ax.hist(values, bins=50, ec="k")
# x 軸のラベルを設定する。
ax.set_xlabel("height (cm)")
# y 軸のラベルを設定する。
ax.set_ylabel("frequency")
# タイトルを設定する。
ax.set_title("stature distribution")
# x 軸、y 軸のラベル及びタイトルを取得する。
print("get_xlabel()", ax.get_xlabel()) # get_xlabel() height (cm)
print("get_ylabel()", ax.get_ylabel()) # get_ylabel() frequency
print("get_title()", ax.get_title()) # get_title() stature distribution
plt.show()get_xlabel() height (cm) get_ylabel() frequency get_title() stature distribution
ラベルのパラメータを設定する
ラベルのフォントサイズ、色など matplotlib.text.Text のパラメータを指定できます。
| パラメータ名 | 内容 | 値 |
|---|---|---|
| alpha | 透過度 | float |
| color / c | フォントの色 | COLOR |
| fontfamily / family | フォントファミリー | {FONTNAME, ‘serif’, ‘sans-serif’, ‘cursive’, ‘fantasy’, ‘monospace’} |
| fontsize / size | フォントサイズ | float or {‘xx-small’, ‘x-small’, ‘small’, ‘medium’, ‘large’, ‘x-large’, ‘xx-large’} |
| fontstyle / style | フォントスタイル | {‘normal’, ‘italic’, ‘oblique’} |
| rotation | 回転 | float or {‘vertical’, ‘horizontal’} |
In [2]:
fig, ax = plt.subplots()

x = np.linspace(0, 10, 100)
y = x ** 2

ax.plot(x, y)
ax.set_title("Title", c="darkred", size="large")

plt.show()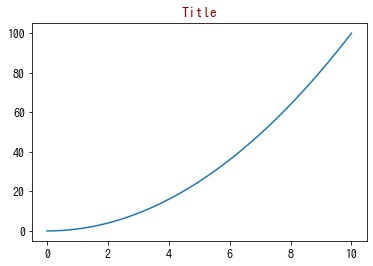
ラベルの位置を揃える
1つの図に複数のグラフがある場合、x 軸、y 軸のラベルはデフォルトでは整列されません。

このラベルを整列したい場合は、Figure.align_labels() を呼び出します。
In [3]:
x = np.linspace(-5, 5, 100)
y = x ** 2

fig, [ax1, ax2] = plt.subplots(1, 2, figsize=(8, 4))

ax1.plot(x, y)
ax2.plot(x, y)
ax1.set_xlabel("X label")
ax2.set_xlabel("X label")

for tick in ax1.get_xticklabels():
    tick.set_rotation(60)

# ラベルの位置を揃える。
fig.align_labels()

plt.show()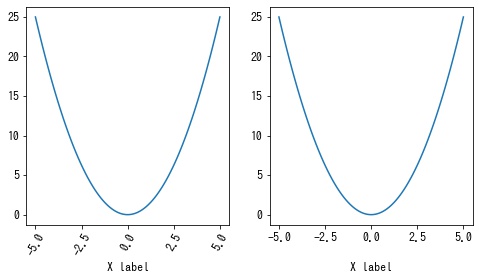
コメント