
目次
概要
OpenCV に画像に図形や文字を描画する関数を整理しました。
関連記事
画像にテキストを描画する方法については、以下の記事を参照してください。
OpenCV/Pillow – 画像にテキストを描画する方法 | pystyle
関数一覧
| 図形 | 関数 |
|---|---|
| テキスト | cv2.putText |
| 長方形 | cv2.rectangle |
| 円 | cv2.circle |
| 楕円 | cv2.ellipse |
| 輪郭 | cv2.drawContours |
| マーカー | cv2.drawMarker |
| 凸なポリゴン | cv2.fillConvexPoly |
| ポリゴン | cv2.fillPoly |
| ポリゴンの輪郭線 | cv2.polylines |
| 線分 | cv2.line |
| 矢印 | cv2.arrowedLine |
描画系関数の共通仕様
- 色は
colorで指定します。1 チャンネル画像の場合は int、3 チャンネル画像の場合は (int, int, int) で指定します。(例:color=(255, 0, 0)) - 線の太さは
thicknessで指定します。負の値を指定した場合は塗りつぶしになります。 - 描画は引数に渡した配列を直接変更します。
- 点の座標や大きさは float ではなく、int で指定します。
長方形を描画する – cv2.rectangle
img = cv2.rectangle(img, pt1, pt2, color[, thickness[, lineType[, shift]]])公式リファレンス: cv2.rectangle
引数
| 名前 | 型 | デフォルト値 |
|---|---|---|
| img | ndarray | |
| 入力画像 | ||
| pt1 | tuple of 2 ints | |
| 長方形の左上の点 | ||
| pt2 | tuple of 2 ints | |
| 長方形の右下の点 | ||
| color | int / tuple of ints | |
| 色 | ||
| thickness | int | 1 |
| 線の太さ。負の値の場合は塗りつぶし。 | ||
| line_type | LineTypes | cv2.LINE_8 |
| 線の描画方法 | ||
| shift | int | 0 |
| 正の値の場合、座標を 1 / shift 倍にスケールする | ||
返り値
| 名前 | 説明 | ||
|---|---|---|---|
| img | 出力画像 | ||
In [1]:
import cv2
from IPython.display import Image, display


def imshow(img):
    """ndarray 配列をインラインで Notebook 上に表示する。"""
    ret, encoded = cv2.imencode(".jpg", img)
    display(Image(encoded))
In [2]:
import cv2
import numpy as np

img = np.zeros((300, 300, 3), dtype=np.uint8)
cv2.rectangle(img, (50, 50), (250, 250), color=(255, 0, 0), thickness=2)
imshow(img)
In [3]:
import cv2
import numpy as np

img = np.zeros((300, 300, 3), dtype=np.uint8)
cv2.rectangle(img, (50, 50), (250, 250), color=(255, 0, 0), thickness=-1)
imshow(img)
円を描画する – cv2.circle
img = cv2.circle(img, center, radius, color[, thickness[, lineType[, shift]]])公式リファレンス: cv2.circle
引数
| 名前 | 型 | デフォルト値 |
|---|---|---|
| img | ndarray | |
| 入力画像 | ||
| center | tuple of 2 ints | |
| 円の中心 | ||
| radius | int | |
| 円の半径 | ||
| color | int / tuple of ints | |
| 色 | ||
| thickness | int | 1 |
| 線の太さ。負の値の場合は塗りつぶし。 | ||
| line_type | LineTypes | cv2.LINE_8 |
| 線の描画方法 | ||
| shift | int | 0 |
| 正の値の場合、座標を 1 / shift 倍にスケールする | ||
返り値
| 名前 | 説明 | ||
|---|---|---|---|
| img | 出力画像 | ||
In [4]:
import cv2
import numpy as np

img = np.zeros((300, 300, 3), dtype=np.uint8)

# 塗りつぶさない円
cv2.circle(img, (150, 150), 100, color=(255, 0, 0), thickness=2)
imshow(img)
In [5]:
import cv2
import numpy as np

img = np.zeros((300, 300, 3), dtype=np.uint8)

# 塗りつぶした円
cv2.circle(img, (150, 150), 100, color=(255, 0, 0), thickness=-1)
imshow(img)
楕円を描画する – cv2.ellipse
img = cv2.ellipse(
    img, center, axes, angle, startAngle, endAngle, color[, thickness[, lineType[, shift]])
公式リファレンス: cv2.ellipse
引数
| 名前 | 型 | デフォルト値 |
|---|---|---|
| img | ndarray | |
| 入力画像 | ||
| center | tuple of 2 ints | |
| 楕円の中心 | ||
| axes | tuple of 2 ints | |
| 楕円の長径、短径 | ||
| angle | float | |
| 楕円の回転角度 | ||
| startAngle | float | |
| 円弧の開始角度 | ||
| endAngle | float | |
| 円弧の終了角度 | ||
| color | int / tuple of ints | |
| 色 | ||
| thickness | int | 1 |
| 線の太さ。負の値の場合は塗りつぶし。 | ||
| line_type | LineTypes | cv2.LINE_8 |
| 線の描画方法 | ||
| shift | int | 0 |
| 正の値の場合、座標を 1 / shift 倍にスケールする | ||
返り値
| 名前 | 説明 | ||
|---|---|---|---|
| img | 出力画像 | ||
楕円を描画する
In [6]:
import cv2
import numpy as np

img = np.zeros((300, 300, 3), dtype=np.uint8)
cv2.ellipse(
    img,
    (150, 150),
    (50, 70),
    angle=45,
    startAngle=0,
    endAngle=360,
    color=(255, 0, 0),
    thickness=2,
)
imshow(img)
In [7]:
import cv2
import numpy as np

img = np.zeros((300, 300, 3), dtype=np.uint8)
cv2.ellipse(
    img,
    (150, 150),
    (50, 70),
    angle=45,
    startAngle=0,
    endAngle=360,
    color=(255, 0, 0),
    thickness=-1,
)
imshow(img)
円弧を描画する
In [8]:
import cv2
import numpy as np

img = np.zeros((300, 300, 3), dtype=np.uint8)
cv2.ellipse(
    img,
    (150, 150),
    (50, 70),
    angle=45,
    startAngle=0,
    endAngle=100,
    color=(255, 0, 0),
    thickness=2,
)
imshow(img)
In [9]:
import cv2
import numpy as np

img = np.zeros((300, 300, 3), dtype=np.uint8)
cv2.ellipse(
    img,
    (150, 150),
    (50, 70),
    angle=45,
    startAngle=0,
    endAngle=100,
    color=(255, 0, 0),
    thickness=-1,
)
imshow(img)
輪郭を描画する
image = cv2.drawContours(image, contours, contourIdx,
                        color[, thickness[, lineType[, hierarchy[, maxLevel[, offset]]]]])
公式リファレンス: cv2.drawContours
引数
| 名前 | 型 | デフォルト値 |
|---|---|---|
| image | ndarray | |
| 入力画像 | ||
| contours | list of ndarrays | |
| 輪郭の一覧 | ||
| contourIdx | int | |
| 輪郭一覧のうち、描画する輪郭のインデックス。すべての輪郭を描画する場合は負の値を指定する。 | ||
| color | int / tuple of ints | |
| 色 | ||
| thickness | int | 1 |
| 線の太さ。負の値の場合は塗りつぶし。 | ||
| line_type | LineTypes | cv2.LINE_8 |
| 線の描画方法 | ||
| hierarchy | ndarray | None |
| 輪郭の階層構造。maxLevel を指定する場合に渡す。 | ||
| maxLevel | int | int の最大値 |
| 階層の深さいくつまで描画するか * 0の場合は contourIdx で指定した輪郭のみ描画する * 1以上の場合は、指定した深さの輪郭まで描画する | ||
| offset | tuple of 2 ints | (0, 0) |
| オフセット | ||
返り値
| 名前 | 説明 | ||
|---|---|---|---|
| image | 出力画像 | ||
すべての輪郭を描画する
In [10]:
import cv2

# 画像を読み込む。
img = cv2.imread("sample1.jpg")

# グレースケールに変換する。
gray = cv2.cvtColor(img, cv2.COLOR_BGR2GRAY)

# 2値化する。
ret, bin_img = cv2.threshold(gray, 0, 255, cv2.THRESH_BINARY + cv2.THRESH_OTSU)

# 輪郭抽出する。
contours, hierarchy = cv2.findContours(
    bin_img, cv2.RETR_EXTERNAL, cv2.CHAIN_APPROX_SIMPLE
)

# すべての輪郭を描画する。
dst = cv2.drawContours(img.copy(), contours, -1, color=(0, 255, 0), thickness=3)
imshow(dst)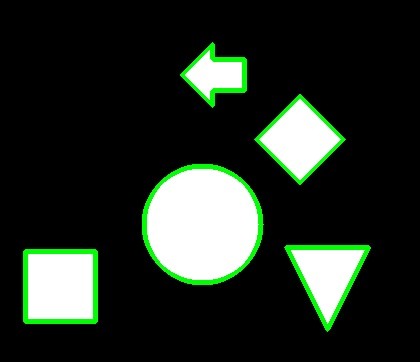
In [11]:
import cv2

# すべての輪郭を塗りつぶして描画する。
dst = cv2.drawContours(img.copy(), contours, -1, color=(0, 255, 0), thickness=-1)
imshow(dst)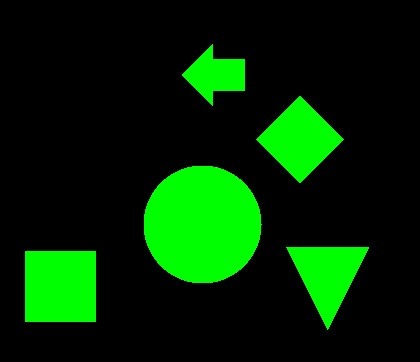
指定した輪郭を描画する
In [12]:
import cv2

# 指定した輪郭を描画する。
dst = cv2.drawContours(img.copy(), contours, 2, color=(0, 255, 0), thickness=2)
imshow(dst)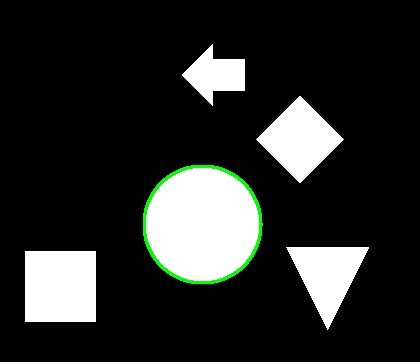
In [13]:
import cv2

# 指定した輪郭を塗りつぶして描画する。
dst = cv2.drawContours(img.copy(), contours, 2, color=(0, 255, 0), thickness=-1)
imshow(dst)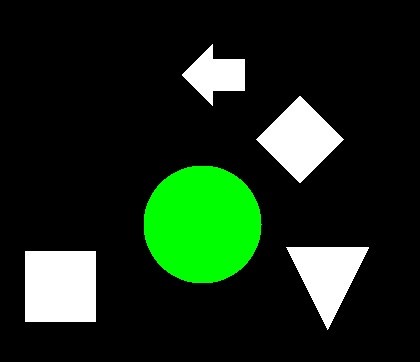
単一の輪郭を描画する
単一の輪郭を描画するには、要素が 1 つのリストにします。
In [14]:
import cv2

cnt = contours[0]
dst = cv2.drawContours(img.copy(), [cnt], -1, color=(0, 255, 0), thickness=2)
imshow(dst)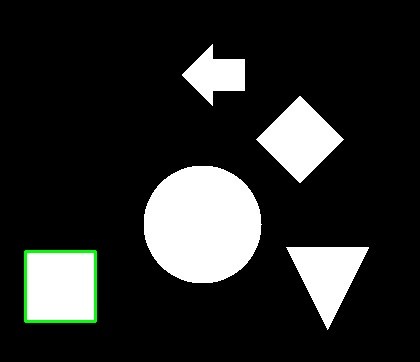
マーカーを描画する – cv2.drawMarker
img = cv2.drawMarker(
    img, position, color[, markerType[, markerSize[, thickness[, line_type]]]])
公式リファレンス: cv2.drawMarker
引数
| 名前 | 型 | デフォルト値 |
|---|---|---|
| img | ndarray | |
| 入力画像 | ||
| position | tuple of 2 ints | |
| 位置 | ||
| color | int / tuple of ints | |
| 色 | ||
| markerType | tuple of 2 ints | |
| 位置 | ||
| markerType | MarkerTypes | cv2.MARKER_CROSS |
| マーカーの種類 | ||
| markerSize | int | 20 |
| マーカーの大きさ | ||
| thickness | int | 1 |
| 線の太さ。負の値の場合は塗りつぶし。 | ||
| line_type | LineTypes | cv2.LINE_8 |
| 線の描画方法 | ||
返り値
| 名前 | 説明 | ||
|---|---|---|---|
| img | 出力画像 | ||
In [15]:
img = np.zeros((100, 100, 3), dtype=np.uint8)
cv2.drawMarker(
    img, (50, 50), color=(255, 0, 0), markerType=cv2.MARKER_TILTED_CROSS, thickness=2
)
imshow(img)
In [16]:
from matplotlib import pyplot as plt

markers = [
    "cv2.MARKER_CROSS",
    "cv2.MARKER_TILTED_CROSS",
    "cv2.MARKER_STAR",
    "cv2.MARKER_DIAMOND",
    "cv2.MARKER_SQUARE",
    "cv2.MARKER_TRIANGLE_UP",
    "cv2.MARKER_TRIANGLE_DOWN",
]

fig = plt.figure(figsize=(8, 8), facecolor="w")

for i, marker in enumerate(markers, 1):
    img = np.zeros((100, 100, 3), dtype=np.uint8)
    cv2.drawMarker(
        img, (50, 50), color=(255, 0, 0), markerType=eval(marker), thickness=2
    )

    ax = fig.add_subplot(3, 3, i)
    ax.set_title(marker)
    ax.imshow(img[..., ::-1])
    ax.set_axis_off()

plt.show()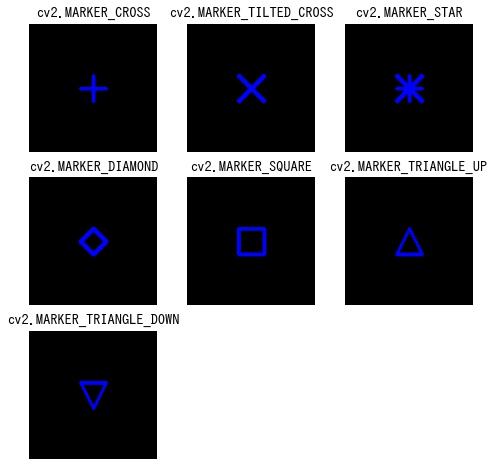
凸なポリゴンを描画する – cv2.fillConvexPoly
img = cv2.fillConvexPoly(img, points, color[, lineType[, shift]])公式リファレンス: cv2.fillConvexPoly
引数
| 名前 | 型 | デフォルト値 |
|---|---|---|
| img | ndarray | |
| 入力画像 | ||
| points | ndarray | |
| 点の一覧 | ||
| color | int / tuple of ints | |
| 色 | ||
| line_type | LineTypes | cv2.LINE_8 |
| 線の描画方法 | ||
| shift | int | 0 |
| 正の値の場合、座標を 1 / shift 倍にスケールする | ||
返り値
| 名前 | 説明 | ||
|---|---|---|---|
| img | 出力画像 | ||
In [17]:
img = np.zeros((300, 300, 3), dtype=np.uint8)
points = np.array([[100, 100], [120, 180], [190, 250], [270, 120], [220, 50]])

cv2.fillConvexPoly(img, points, color=(0, 255, 0))
imshow(img)
ポリゴンを描画する – cv2.fillPoly
img = cv2.fillPoly(img, pts, color[, lineType[, shift[, offset]]])公式リファレンス: cv2.fillPoly
引数
| 名前 | 型 | デフォルト値 |
|---|---|---|
| img | ndarray | |
| 入力画像 | ||
| points | ndarray | |
| 点の一覧 | ||
| color | int / tuple of ints | |
| 色 | ||
| line_type | LineTypes | cv2.LINE_8 |
| 線の描画方法 | ||
| shift | int | 0 |
| 正の値の場合、座標を 1 / shift 倍にスケールする | ||
| offset | tuple of 2 ints | (0, 0) |
| オフセット | ||
返り値
| 名前 | 説明 | ||
|---|---|---|---|
| img | 出力画像 | ||
In [18]:
img = np.zeros((300, 300, 3), dtype=np.uint8)
points = np.array([[100, 50], [120, 180], [50, 250], [270, 120], [220, 50]]).reshape(
    1, -1, 2
)

cv2.fillPoly(img, points, color=(0, 255, 0))
imshow(img)
ポリゴンの輪郭線を描画する – cv2.polylines
img = cv2.polylines(img, pts, isClosed, color[, thickness[, lineType[, shift]]])公式リファレンス: cv2.polylines
引数
| 名前 | 型 | デフォルト値 |
|---|---|---|
| img | ndarray | |
| 入力画像 | ||
| pts | ndarray | |
| 点の一覧 | ||
| isClosed | bool | |
| ポリゴンが閉じているかどうか | ||
| color | int / tuple of ints | |
| 色 | ||
| thickness | int | 1 |
| 線の太さ | ||
| line_type | LineTypes | cv2.LINE_8 |
| 線の描画方法 | ||
| shift | int | 0 |
| 正の値の場合、座標を 1 / shift 倍にスケールする | ||
返り値
| 名前 | 説明 | ||
|---|---|---|---|
| img | 出力画像 | ||
In [19]:
img = np.zeros((300, 300, 3), dtype=np.uint8)
points = np.array([[100, 50], [120, 180], [50, 250], [270, 120], [220, 50]]).reshape(
    1, -1, 2
)

cv2.polylines(img, points, isClosed=True, color=(0, 255, 0), thickness=2)
imshow(img)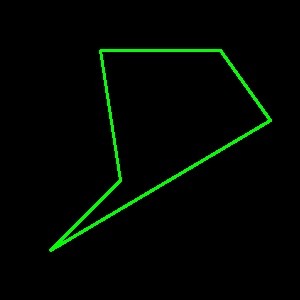
線分を描画する – cv2.line
img = cv2.line(img, pt1, pt2, color[, thickness[, lineType[, shift]]])公式リファレンス: cv2.line
引数
| 名前 | 型 | デフォルト値 |
|---|---|---|
| img | ndarray | |
| 入力画像 | ||
| pt1 | tuple of 2 ints | |
| 線分の始点 | ||
| pt2 | tuple of 2 ints | |
| 線分の終点 | ||
| color | int / tuple of ints | |
| 色 | ||
| thickness | int | 1 |
| 線の太さ | ||
| line_type | LineTypes | cv2.LINE_8 |
| 線の描画方法 | ||
| shift | int | 0 |
| 正の値の場合、座標を 1 / shift 倍にスケールする | ||
| offset | tuple of 2 ints | (0, 0) |
| オフセット | ||
返り値
| 名前 | 説明 | ||
|---|---|---|---|
| img | 出力画像 | ||
In [20]:
img = np.zeros((300, 300, 3), dtype=np.uint8)
cv2.line(img, (50, 50), (250, 250), color=(255, 0, 0), thickness=2)
imshow(img)
矢印を描画する – cv2.arrowedLine
img = cv2.arrowedLine(
    img, pt1, pt2, color[, thickness[, line_type[, shift[, tipLength]]]])
公式リファレンス: cv2.arrowedLine
引数
| 名前 | 型 | デフォルト値 |
|---|---|---|
| img | ndarray | |
| 入力画像 | ||
| pt1 | tuple of 2 ints | |
| 矢印の始点 | ||
| pt2 | tuple of 2 ints | |
| 矢印の終点 | ||
| color | int / tuple of ints | |
| 色 | ||
| thickness | int | 1 |
| 線の太さ。負の値の場合は塗りつぶし。 | ||
| line_type | LineTypes | cv2.LINE_8 |
| 線の描画方法 | ||
| shift | int | 0 |
| 正の値の場合、座標を 1 / shift 倍にスケールする | ||
| tipLength | float | 0.1 |
| 矢印の長さに対する末端の長さ | ||
返り値
| 名前 | 説明 | ||
|---|---|---|---|
| img | 出力画像 | ||
In [21]:
img = np.zeros((300, 300, 3), dtype=np.uint8)
cv2.arrowedLine(img, (50, 50), (250, 250), color=(255, 0, 0), thickness=2)

imshow(img)
コメント