目次
概要
カメラキャリブレーションで求めた内部パラメータ、外部パラメータを使用して、3 次元空間上の点を画像上に投影する方法について解説します。
関連記事
カメラモデルおよびカメラキャリブレーションの方法については以下の記事を参照してください。
手順
1. カメラパラメータを推定する
こちらの記事 を参考に、すでにカメラの内部パラメータが得られているものとします。
In [1]:
import cv2
import numpy as np
import matplotlib.pyplot as plt

# 推定済みの内部パラメータを読み込む。
params = np.load("camera_params.npz")
camera_matrix = params["camera_matrix"]
distortion = params["distortion"]
print("camera matrix", camera_matrix, sep="\n")
print("distortion", distortion, sep="\n")
camera matrix [[465.37442759 0. 338.20216266] [ 0. 466.22907443 218.85083528] [ 0. 0. 1. ]] distortion [[-0.01356546 0.00182163 -0.00132746 0.00026079 0.03298632]]
2. キャリブレーション器具を使用して外部パラメータを推定する
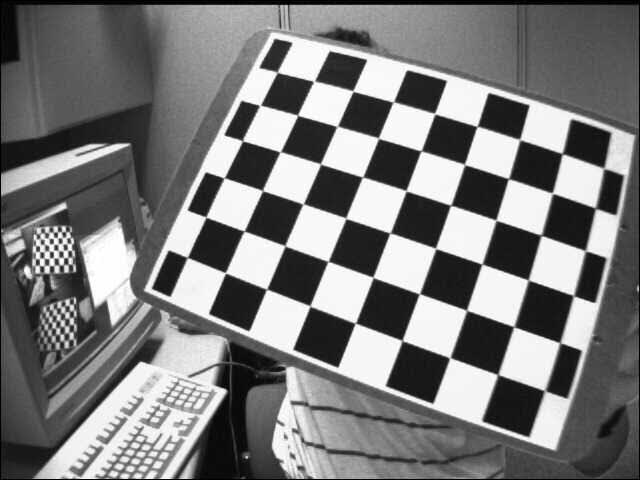
キャリブレーションを行ったカメラで、チェスボードを撮影します。
撮影した画像を読み込み、cv2.findChessboardCorners() を使用して交点検出を行います。
In [2]:
# 画像を読み込む。
img = cv2.imread("sample.jpg")

# 画像をグレースケールに変換する。
gray = cv2.cvtColor(img, cv2.COLOR_BGR2GRAY)

# チェスボードの設定
cols = 9  # 列方向の交点数
rows = 6  # 行方向の交点数

# チェスボードの交点を検出する。
ret, corners = cv2.findChessboardCorners(img, (cols, rows))
assert ret, "交点検出に失敗しました。"
画像座標系での検出された交点に対応する、変換元の世界座標系での座標を作成します。 世界座標系の原点や向き、スケールなどは自由に決めてよいですが、通常はキャリブレーションボード上を $Z = 0$ とし、横方向を $X$ 軸、縦方向を $Y$ 軸と一致させます。
世界座標系の座標と画像座標系の座標のペアを作成できたら、cv2.solvePnP() を使用して、外部パラメータを推定します。
In [3]:
def create_world_point(rows, cols, scale=1):
    # 検出した画像座標系の点に対応する 3 次元上の点を作成する。
    world_point = np.zeros((rows * cols, 3), np.float32)
    world_point[:, :2] = np.mgrid[:cols, :rows].T.reshape(-1, 2)

    return world_point


# 外部パラメータを推定する。
world_point = create_world_point(rows, cols)
ret, rvecs, tvecs = cv2.solvePnP(world_point, corners, camera_matrix, distortion)
print("rvecs:\n", rvecs)
print("tvecs:\n", tvecs)
rvecs: [[-0.25256278] [ 0.1218064 ] [ 0.34988661]] tvecs: [[-1.56055519] [-3.70281197] [11.43826942]]
座標軸を画像上に描画する
内部パラメータおよび外部パラメータを使用して、世界座標系の座標 $(0, 0, 0), (1, 0, 0), (0, 1, 0), (0, 0, 1)$ を画像に投影します。
In [4]:
# 3次元上の点を画像上に変換する。
world_points = np.float32([[0, 0, 0], [1, 0, 0], [0, 1, 0], [0, 0, 1]])
img_points, jacobian = cv2.projectPoints(
    world_points, rvecs, tvecs, camera_matrix, distortion
)

# 変換した点を描画する。
fig, ax = plt.subplots(facecolor="w")
ax.imshow(cv2.cvtColor(img, cv2.COLOR_BGR2RGB))

# 点を描画する。
img_points = img_points.squeeze(axis=1)
ax.plot(img_points[[0, 1], 0], img_points[[0, 1], 1], c="r", lw=3)
ax.plot(img_points[[0, 2], 0], img_points[[0, 2], 1], c="g", lw=3)
ax.plot(img_points[[0, 3], 0], img_points[[0, 3], 1], c="b", lw=3)

plt.show()立方体を描画する
1 辺の長さが世界座標系で 3 である立方体を画像に投影します。
In [5]:
# 3次元上の点を画像上に変換する。
world_points = np.float32(
    [
        [0, 0, 0],
        [0, 3, 0],
        [3, 3, 0],
        [3, 0, 0],
        [0, 0, -3],
        [0, 3, -3],
        [3, 3, -3],
        [3, 0, -3],
    ]
)
img_points, jacobian = cv2.projectPoints(
    world_points, rvecs, tvecs, camera_matrix, distortion
)
print(img_points.shape)  # (8, 1, 2)

# 変換した点を描画する。
img_points = img_points.squeeze(axis=1)

fig, ax = plt.subplots(facecolor="w")
ax.imshow(cv2.cvtColor(img, cv2.COLOR_BGR2RGB))

# 点を描画する。
ax.scatter(img_points[:, 0], img_points[:, 1], c="r")

# 面を描画する。
face_indices = [
    [0, 1, 2, 3],
    [4, 5, 6, 7],
    [0, 1, 5, 4],
    [2, 3, 7, 6],
    [1, 2, 6, 5],
    [4, 7, 3, 0],
]
for face_idx in face_indices:
    face = img_points[face_idx]
    ax.add_patch(plt.Polygon(face, fc="none", ec="b", lw=2))

plt.show()
(8, 1, 2)


コメント