概要
OpenCV の cv2.HoughLines、cv2.HoughLinesP を使用して直線を検出する方法について解説します。
cv2.HoughLines
lines = cv2.HoughLines(image, rho, theta, threshold[, lines[, srn[, stn[, min_theta[, max_theta]]]]])公式リファレンス: cv2.HoughLines
| 名前 | 型 | デフォルト値 |
|---|---|---|
| image | ndarray | |
| 入力画像 (1チャンネル) | ||
| rho | float | |
| 投票の rho の解像度 (ピクセル) | ||
| theta | float | |
| 投票の theta の解像度 (ピクセル) | ||
| threshold | int | |
| 直線と判断する投票数 | ||
| min_theta | float | 0 |
| パラメータ $\theta$ の下限を $[0, maxtheta]$ の範囲で指定する | ||
| max_theta | float | $\pi$ |
| パラメータ $\theta$ の上限を $[mintheta, \pi]$ の範囲で指定する | ||
| 名前 | 説明 | ||
|---|---|---|---|
| lines | 検出された直線のパラメータ一覧。各要素は $(\theta, \rho)$ のタプル。1つも直線が検出されない場合は None を返す。 | ||
サンプルコード
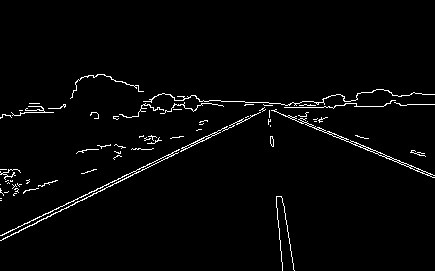
ハフ変換の入力は 2 値画像であるため、Canny 法でエッジを抽出した 2 値画像を作成します。
cv2.HoughLines() に 2 値画像を渡すと、検出された直線の一覧を形状が (NumLines, 1, 2) の ndarray で返します。
各要素は直線のパラメータ $\theta, \rho$ を表します。
import cv2
from IPython.display import Image, display


def imshow(img):
    """ndarray 配列をインラインで Notebook 上に表示する。"""
    ret, encoded = cv2.imencode(".jpg", img)
display(Image(encoded))import cv2
import numpy as np
# 画像を読み込む。
img = cv2.imread("sample1.jpg")
# グレースケールに変換する。
gray = cv2.cvtColor(img, cv2.COLOR_BGR2GRAY)
# Canny 法で2値化する。
edges = cv2.Canny(gray, 150, 300, L2gradient=True)
imshow(edges)
# ハフ変換で直線検出する。
lines = cv2.HoughLines(edges, 1, np.pi / 180, 100)
lines = lines.squeeze(axis=1) # (N, 1, 2) -> (N, 2)
print(lines.shape)
(10, 2)
直線を matplotlib で描画します。
$\theta, \rho$ で表される直線のうち、画像内の始点と終点の座標を求めます。 $\sin \theta = 0$ の場合、2 点 $(\rho, 0), (\rho, Height)$ を結ぶ垂直方向の線分になります。 それ以外の場合、
$$ y = \frac{\rho}{\sin \theta} – x \frac{\cos \theta}{\sin \theta} $$で $y$ 座標を計算します。
def draw_line(img, theta, rho):
    h, w = img.shape[:2]
    if np.isclose(np.sin(theta), 0):
        x1, y1 = rho, 0
        x2, y2 = rho, h
    else:
        calc_y = lambda x: rho / np.sin(theta) - x * np.cos(theta) / np.sin(theta)
        x1, y1 = 0, calc_y(0)
        x2, y2 = w, calc_y(w)

    # float -> int
    x1, y1, x2, y2 = list(map(int, [x1, y1, x2, y2]))

    cv2.line(img, (x1, y1), (x2, y2), (0, 0, 255), 1)


# 直線を描画する。
if lines is not None:
    for rho, theta in lines:
        draw_line(img, theta, rho)
imshow(img)
ipywidgets でパラメータ調整する
ハフ変換はパラメータ調整が必須です。ipywidgets を使って GUI 上でパラメータ調整を行う方法について記載します。
import cv2
from IPython.display import Image, display
from ipywidgets import widgets


def imshow(img):
    """ndarray 配列をインラインで Notebook 上に表示する。"""
    ret, encoded = cv2.imencode(".jpg", img)
    display(Image(encoded))


def houghline(img, rho, theta, threshold, theta_range):
    """ハフ変換で直線検出を行い、結果を表示する。"""
    # グレースケールに変換する。
    gray = cv2.cvtColor(img, cv2.COLOR_BGR2GRAY)
    # Canny 法で2値化する。
    edges = cv2.Canny(gray, 150, 300, L2gradient=True)
    # ハフ変換で直線検出する。
    lines = cv2.HoughLines(
        edges,
        rho,
        np.radians(theta),
        threshold,
        min_theta=np.radians(theta_range[0]),
        max_theta=np.radians(theta_range[1]),
    )
    # 検出した直線を描画する。
    dst = img.copy()

    if lines is not None:
        for rho, theta in lines.squeeze(axis=1):
            draw_line(dst, theta, rho)
    imshow(dst)


# パラメータ「rho」を設定するスライダー
rho_slider = widgets.IntSlider(min=1, max=10, step=1, value=1, description="rho: ")
rho_slider.layout.width = "400px"

# パラメータ「theta」を設定するスライダー
theta_slider = widgets.IntSlider(min=1, max=180, step=1, value=1, description="theta: ")
theta_slider.layout.width = "400px"

# パラメータ「threshold」を設定するスライダー
threshold_slider = widgets.IntSlider(
    min=0, max=500, step=1, value=100, description="threshold: "
)
threshold_slider.layout.width = "400px"

# パラメータ「min_theta」「max_theta」を設定するスライダー
theta_range_slider = widgets.IntRangeSlider(
    value=(0, 180), min=0, max=180, step=1, description="theta range: "
)
theta_range_slider.layout.width = "400px"

# 画像を読み込む。
img = cv2.imread("sample1.jpg")

# ウィジェットを表示する。
widgets.interactive(
    houghline,
    img=widgets.fixed(img),
    rho=rho_slider,
    theta=theta_slider,
    threshold=threshold_slider,
    theta_range=theta_range_slider,
)
cv2.HoughLine
cv2.HoughLine() は直線を検出してそのパラメータを返すのに対し、この関数は線分を検出して、線分の始点と終点を返します。
lines = cv2.HoughLinesP(image, rho, theta, threshold[, lines[, minLineLength[, maxLineGap]]])公式リファレンス: cv2.HoughLinesP
| 名前 | 型 | デフォルト値 |
|---|---|---|
| image | ndarray | |
| 入力画像 (1チャンネル) | ||
| rho | float | |
| 投票の rho の解像度 (ピクセル) | ||
| theta | float | |
| 投票の theta の解像度 (ピクセル) | ||
| threshold | int | |
| 直線と判断する投票数 | ||
| minLineLength | float | 0 |
| この長さ未満の線分は検出対象外とする | ||
| maxLineGap | float | $\pi$ |
| 同じ直線上の点と解釈するギャップの最大値 | ||
| 名前 | 説明 | ||
|---|---|---|---|
| lines | 検出された線分の一覧。各要素は (x1, y2, x2, y2) のタプル。1つも線分が見つからない場合は None を返す。 | ||
サンプルコード
import cv2

# 画像を読み込む。
img = cv2.imread("sample2.jpg")

# グレースケールに変換する。
gray = cv2.cvtColor(img, cv2.COLOR_BGR2GRAY)

# Canny で2値化する。
edges = cv2.Canny(gray, 150, 300, L2gradient=True)
imshow(edges)

# 確率的ハフ変換で直線検出する。
lines = cv2.HoughLinesP(edges, 1, np.pi / 180, threshold=70, maxLineGap=100)
lines = lines.squeeze(axis=1)  # (N, 1, 4) -> (N, 4)
print(lines)

# 直線を描画する。
if lines is not None:
    for x1, y1, x2, y2 in lines:
        cv2.line(img, (x1, y1), (x2, y2), (0, 0, 255), 2)
imshow(img)
[[336 366 336   1]
 [123 325 123  43]
 [139 328 139  41]
 [  2  66 335   1]
 [  4 303 332 367]
 [  0 300   0  68]
 [141 192 335 195]
 [107 177 335 174]
 [ 27 191 185 193]
 [  2 178 221 175]]

import cv2
from IPython.display import Image, display
from ipywidgets import widgets


def imshow(img):
    """ndarray 配列をインラインで Notebook 上に表示する。"""
    ret, encoded = cv2.imencode(".jpg", img)
    display(Image(encoded))


def houghline(img, rho, theta, threshold, min_line_len, max_line_gap):
    """ハフ変換で直線検出を行い、結果を表示する。"""
    # グレースケールに変換する。
    gray = cv2.cvtColor(img, cv2.COLOR_BGR2GRAY)
    # Canny 法で2値化する。
    edges = cv2.Canny(gray, 150, 300, L2gradient=True)
    # ハフ変換で直線検出する。
    lines = cv2.HoughLinesP(
        edges,
        rho,
        np.radians(theta),
        threshold,
        minLineLength=min_line_len,
        maxLineGap=max_line_gap,
    )
    # 検出した直線を描画する。
    dst = img.copy()

    if lines is not None:
        for x1, y1, x2, y2 in lines.squeeze(axis=1):
            cv2.line(dst, (x1, y1), (x2, y2), (0, 0, 255), 2)
    imshow(dst)


# パラメータ「rho」を設定するスライダー
rho_slider = widgets.IntSlider(min=1, max=10, step=1, value=1, description="rho: ")
rho_slider.layout.width = "400px"

# パラメータ「theta」を設定するスライダー
theta_slider = widgets.IntSlider(min=1, max=180, step=1, value=1, description="theta: ")
theta_slider.layout.width = "400px"

# パラメータ「threshold」を設定するスライダー
threshold_slider = widgets.IntSlider(
    min=0, max=500, step=1, value=100, description="threshold: "
)
threshold_slider.layout.width = "400px"

# パラメータ「min_theta」「max_theta」を設定するスライダー
theta_range_slider = widgets.IntRangeSlider(
    value=(0, 180), min=0, max=180, step=1, description="theta range: "
)
theta_range_slider.layout.width = "400px"

# パラメータ「minLineLength」を設定するスライダー
min_line_len_slider = widgets.IntSlider(
    min=0, max=500, step=1, value=0, description="minLineLength: "
)
min_line_len_slider.layout.width = "400px"

# パラメータ「maxLineGap」を設定するスライダー
max_line_gap_slider = widgets.IntSlider(
    min=0, max=500, step=1, value=50, description="maxLineGap: "
)
max_line_gap_slider.layout.width = "400px"

# 画像を読み込む。
img = cv2.imread("sample2.jpg")

# ウィジェットを表示する。
widgets.interactive(
    houghline,
    img=widgets.fixed(img),
    rho=rho_slider,
    theta=theta_slider,
    threshold=threshold_slider,
    min_line_len=min_line_len_slider,
    max_line_gap=max_line_gap_slider,
)
ハフ変換の仕組み
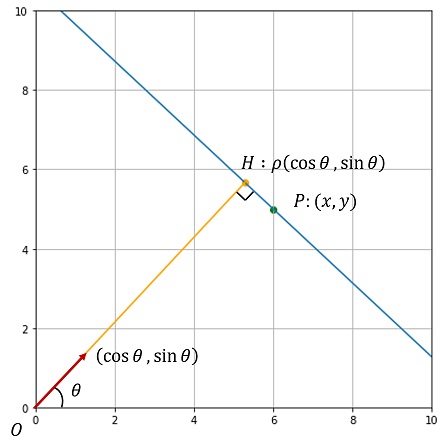
任意の直線は ρ、θ で表せる
直線上の任意の点を $\overrightarrow{OP} = (x, y)^T$ とする。 原点から直線に垂線を下ろし、その点を $\overrightarrow{OH}$ とすると、$\overrightarrow{OH} = (\rho \cos \theta, \rho \sin \theta)^T$ と表せる。
$\overrightarrow{HP}$ と $\overrightarrow{OH}$ は直交するので、
$$ \begin{aligned} \overrightarrow{HP} \cdot \overrightarrow{OH} &= 0 \\ (\overrightarrow{OP} – \overrightarrow{OH}) \cdot \overrightarrow{OH} &= 0 \\ \overrightarrow{OP} \cdot \overrightarrow{OH} &= \overrightarrow{OH} \cdot \overrightarrow{OH} \\ x \rho \cos \theta + y \rho \sin \theta &= \rho^2 \\ x \cos \theta + y \sin \theta &= \rho \end{aligned} $$
複数の点を通る直線のパラメータを求める
2 点 $(x_1, y_1)$、$(x_2, y_2)$ が同一直線上にあるとき、その直線が $\theta, \rho$ で表されるとすると、次を満たします。
$$ \begin{aligned} x_1 \cos \theta + y_1 \sin \theta &= \rho \\ x_2 \cos \theta + y_2 \sin \theta &= \rho \end{aligned} $$したがって、$\theta$-$\rho$ 空間の交点が 2 点を通る直線の $\theta, \rho$ のパラメータであることがわかります。
ハフ変換での利用
$\theta$-$\rho$ 空間にビンを作成し、画像上の各特徴点を通る直線を該当するビンに投票します。値が大きいビンに該当する直線は複数の特徴点を通っているということがわかります。


コメント