概要
OpenCV でネガポジ反転やポスタリゼーションなどの階調変換を画像に適用する方法を紹介します。
階調変換
画素値の入力を $x \in [0, 255]$ としたとき、$f(x) = y \in [0, 255]$ という関数で変換することを階調変換 (gray level transformation)、階調変換を規定する関数を階調変換関数 (gray level transformation function) といいます。
実装上は、画素値は $[0, 255]$ の 256 種類なので、入力値の変換後の値を格納した長さが 256 の 1 次元配列である LUT (Look Up Table) を用意して階調変換を行います。例えば、LUT[0] = 100 だった場合、入力値 0 は値 100 に変換されることを意味します。
cv2.LUT
OpenCV では、cv2.LUT() で階調変換が行えます。
dst = cv2.LUT(src, lut[, dst])| 名前 | 型 | デフォルト値 |
|---|---|---|
| src | ndarray | |
| 入力画像 | ||
| lut | sequence of int | |
| Look Up Table の略。[0, 255] の値の変換後の値を (256,) の1次元配列で表す。例えば、lut[10] は入力10の変換後の値を表す。 | ||
| 名前 | 説明 | ||
|---|---|---|---|
| dst | 変換後の画像 | ||
import cv2
import numpy as np
from IPython.display import Image, display


def imshow(img):
    """ndarray 配列をインラインで Notebook 上に表示する。"""
    ret, encoded = cv2.imencode(".jpg", img)
    display(Image(encoded))
ネガポジ反転
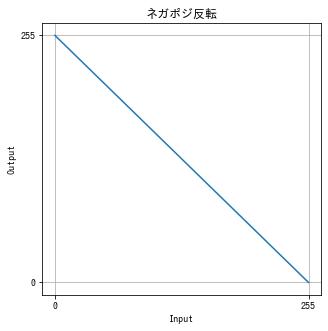
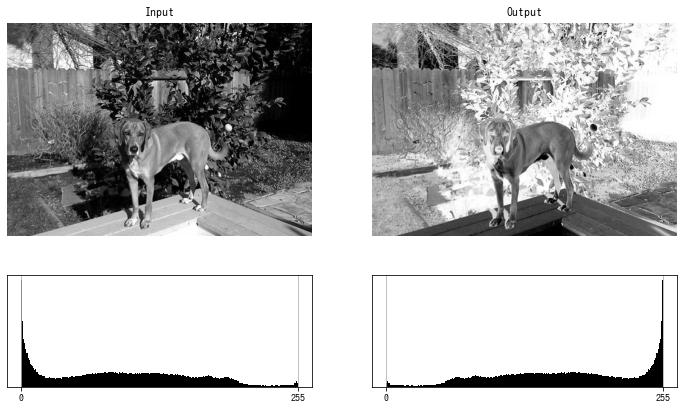
画素値を反転させる階調変換をネガポジ反転といいます。
$f(x) = 255 – x$
def invert(img):
    # ネガポジ反転
    y = 255 - np.arange(256)
    dst = cv2.LUT(img, y).astype(np.uint8)

    return dst


img = cv2.imread("sample.jpg", cv2.IMREAD_GRAYSCALE)

dst = invert(img)
imshow(dst)
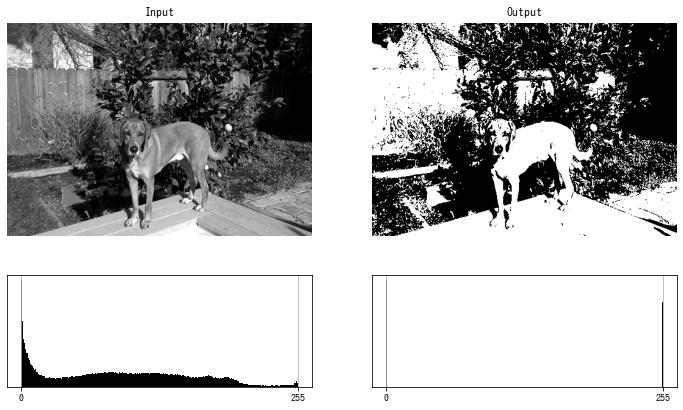
2 値化
閾値などの条件で入力値を 2 段階にする階調変換を2 値化 (binarization) といいます。
$$ f(x) = \begin{cases} 0 & x \le \mathrm{threshold} \\ 255 & その他の場合 \end{cases} $$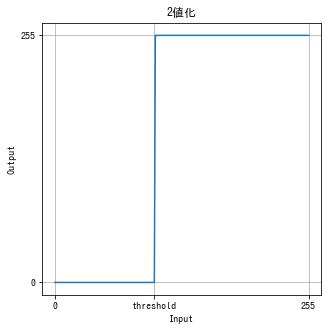
def binarize(img, threshold):
    # 2値化
    x = np.arange(256)
    y = np.where(x <= threshold, 0, 255)

    dst = cv2.LUT(img, y).astype(np.uint8)

    return dst


img = cv2.imread("sample.jpg", cv2.IMREAD_GRAYSCALE)

dst = binarize(img, threshold=100)
imshow(dst)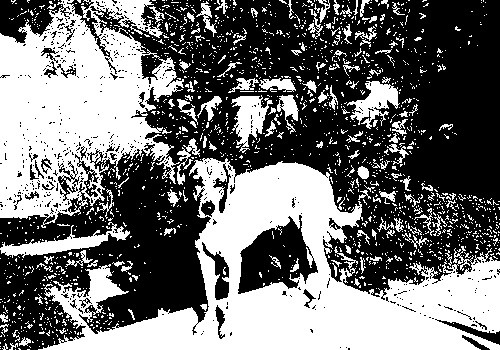
ポスタリゼーション
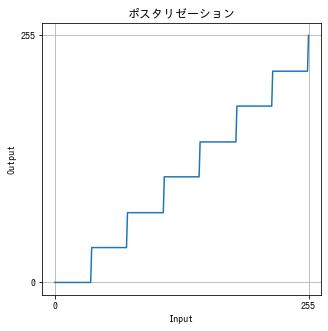
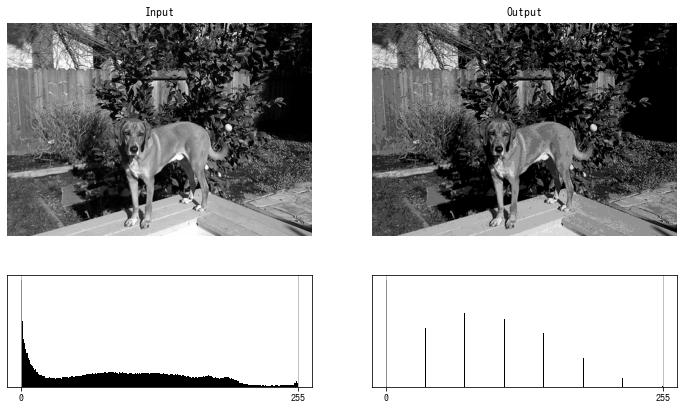
色を $n$ 段階にする階調変換をポスタリゼーション (postarization) といいます。
$[0, 255]$ の範囲に $n$ 個の区間を用意して、各値がどの区間に属するかを numpy.digitize() で調べて、LUT を作成します。
def postalize(img, n):
    # ポスタリゼーション
    x = np.arange(256)
    bins = np.linspace(0, 255, n + 1)
    y = np.array([bins[i - 1] for i in np.digitize(x, bins)]).astype(int)

    dst = cv2.LUT(img, y).astype(np.uint8)

    return dst


img = cv2.imread("sample.jpg", cv2.IMREAD_GRAYSCALE)

dst = postalize(img, n=7)
imshow(dst)
ソラリゼーション
過度の露光で画像の一部が反転する現象を ソラリゼーション (solarization) といいます。 以下の関数でソラリゼーションを擬似的に再現できます。
$$ f(x) = \begin{cases} x & x \le \mathrm{threshold} \\ 255 – x & その他の場合 \end{cases} $$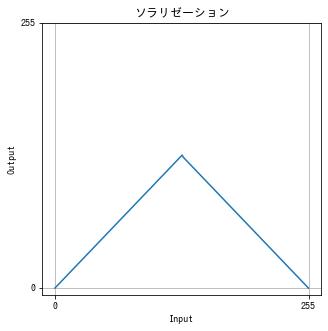
def solarize(img, threshold):
    # ソラリゼーション
    x = np.arange(256)
    y = np.where(x <= threshold, x, 255 - x)

    dst = cv2.LUT(img, y).astype(np.uint8)

    return dst


img = cv2.imread("sample.jpg", cv2.IMREAD_GRAYSCALE)

dst = solarize(img, threshold=128)
imshow(dst)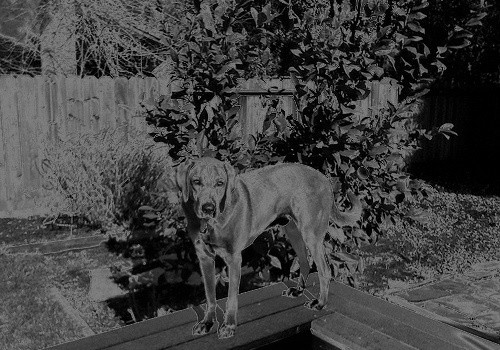
折れ線型トーンカーブ
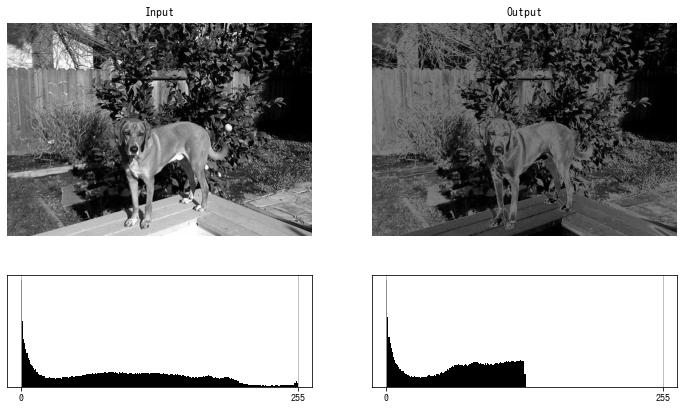
折れ線で表される階調変換関数を折れ線型トーンカーブといいます。
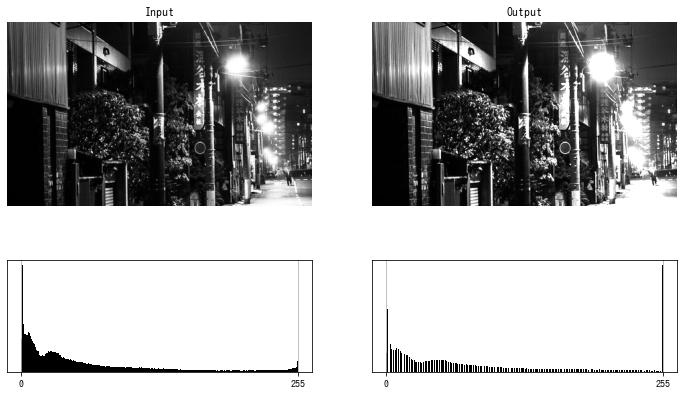
コントラストを上げる (1)
$$ f(x) = \begin{cases} \frac{255}{t} & x \le t \\ 255 & x > t \end{cases} = \text{clip}\left(\frac{255}{t}, 0, 255\right) $$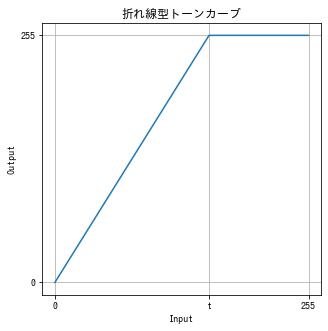
def increase_contrast(img, t):
    x = np.arange(256)
    y = np.clip(255 / t * x, 0, 255)

    dst = cv2.LUT(img, y).astype(np.uint8)

    return dst


img = cv2.imread("sample2.jpg", cv2.IMREAD_GRAYSCALE)

dst = increase_contrast(img, t=155)
imshow(dst)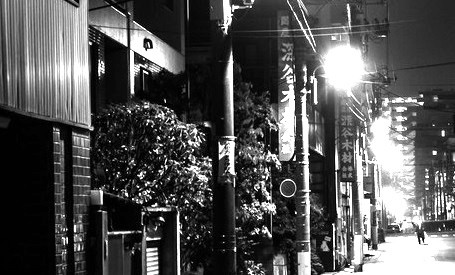
コントラストを上げる (2)
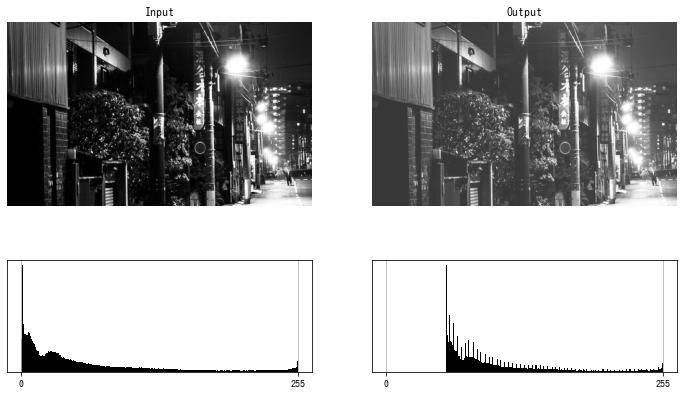
$$ f(x) = \frac{255 – t}{255} x + t $$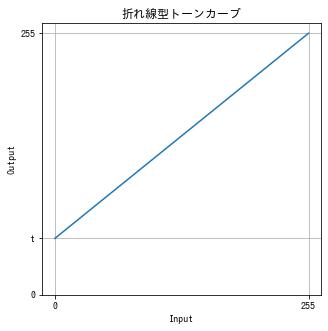
def increase_contrast(img, t):
    x = np.arange(256)
    y = (255 - t) / 255 * x + t

    dst = cv2.LUT(img, y).astype(np.uint8)

    return dst


img = cv2.imread("sample2.jpg", cv2.IMREAD_GRAYSCALE)

dst = increase_contrast(img, t=55)
imshow(dst)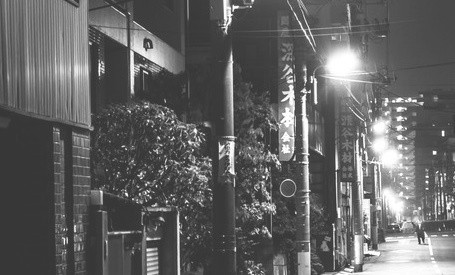
コントラストを下げる (1)
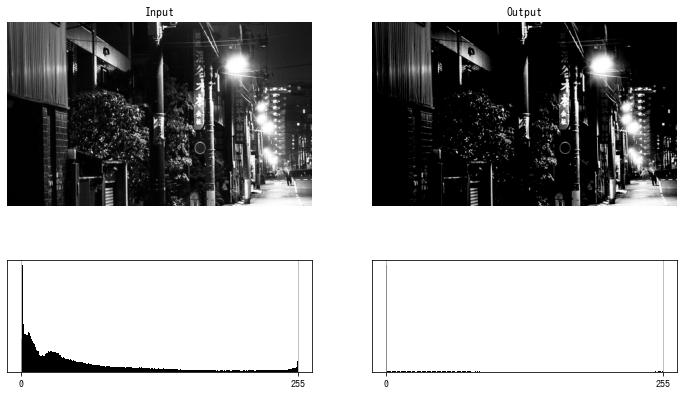
$$ f(x) = \begin{cases} 0 & x \le t \\ \frac{255 + b}{255}x – b & x > t \end{cases} = \text{clip}\left(\frac{255 + b}{255}x – b, 0, 255\right) $$ただし、$b$ は次を解いて得られる値です。
$$ \frac{255 + b}{255}t – b = 0 $$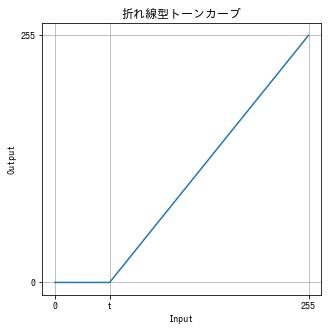
def decrease_contrast(img, t):
    x = np.arange(256)
    y = np.clip(255 / (255 - t) * x - 255 / (255 - t) * t, 0, 255)

    dst = cv2.LUT(img, y).astype(np.uint8)

    return dst


img = cv2.imread("sample2.jpg", cv2.IMREAD_GRAYSCALE)

dst = decrease_contrast(img, t=55)
imshow(dst)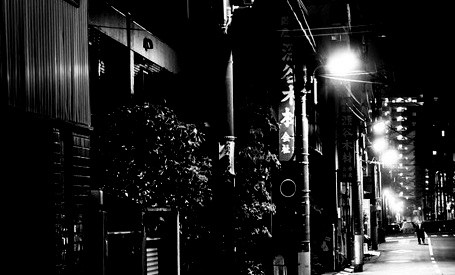
コントラストを下げる (2)
$$ f(x) = \frac{t}{255} $$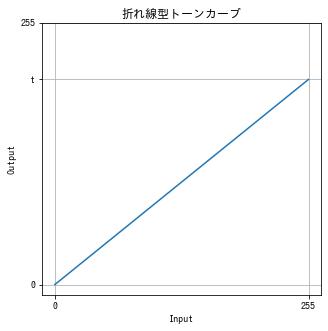
def decrease_contrast(img, t):
    x = np.arange(256)
    y = t / 255 * x

    dst = cv2.LUT(img, y).astype(np.uint8)

    return dst


img = cv2.imread("sample2.jpg", cv2.IMREAD_GRAYSCALE)

dst = decrease_contrast(img, t=200)
imshow(dst)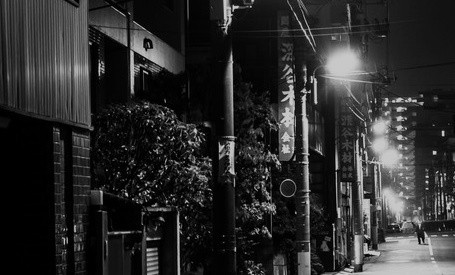
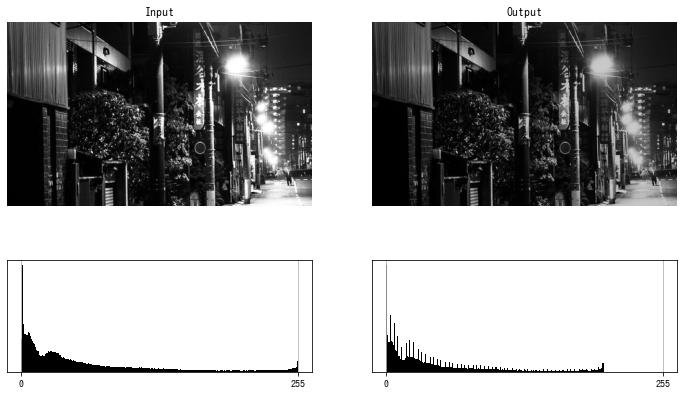
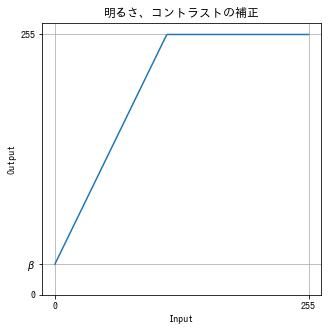
明るさ、コントラストの補正
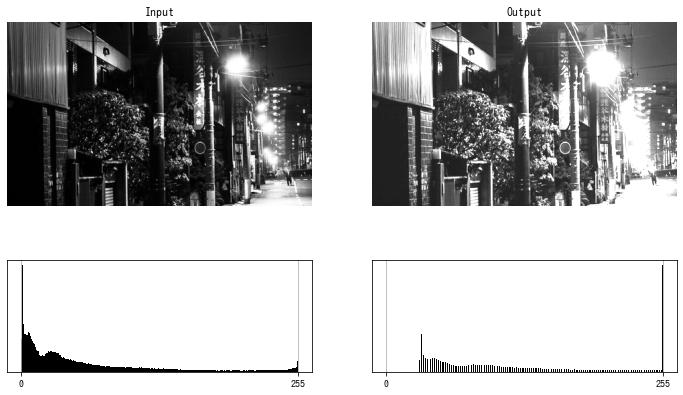
$$ f(x) = \text{clip}(\alpha x + \beta , 0, 255) $$$\alpha$ はゲイン (gain) またはコントラスト (contrast)、$\beta$ はバイアス (bias) または明るさ (brightness) といいます。
def adjust(img, alpha, beta):
    x = np.arange(256)
    y = np.clip(alpha * x + beta, 0, 255)

    dst = cv2.LUT(img, y).astype(np.uint8)

    return dst


img = cv2.imread("sample2.jpg", cv2.IMREAD_GRAYSCALE)

dst = adjust(img, alpha=2, beta=30)
imshow(dst)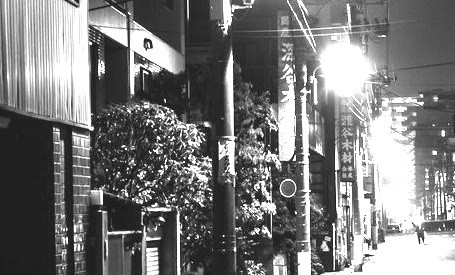
ガンマ補正
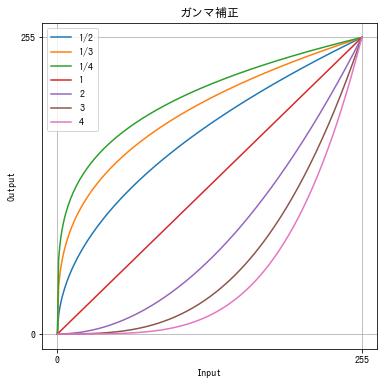
次の関数で行う階調変換をガンマ変換 (gamma transformation) またはガンマ補正 (gamma correction) といいます。
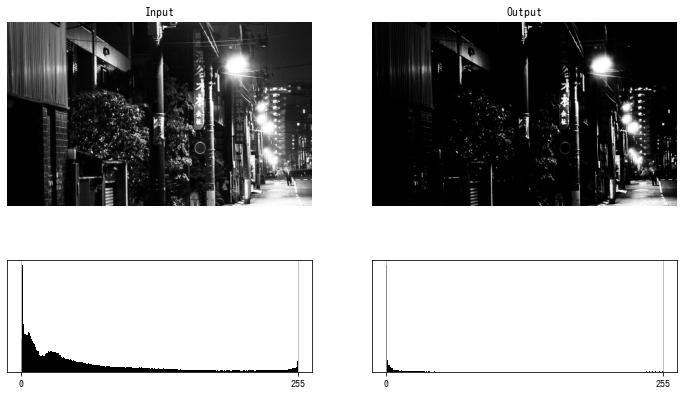
$$ f(x) = \left(\frac{x}{255}\right)^\gamma \times 255 $$$\gamma < 1$ で暗く、$\gamma > 1$ で明るくなるように補正できます。
def gamma_correction(img, gamma):
    x = np.arange(256)
    y = (x / 255) ** gamma * 255

    dst = cv2.LUT(img, y).astype(np.uint8)

    return dst


img = cv2.imread("sample2.jpg", cv2.IMREAD_GRAYSCALE)

dst = gamma_correction(img, gamma=0.3)
imshow(dst)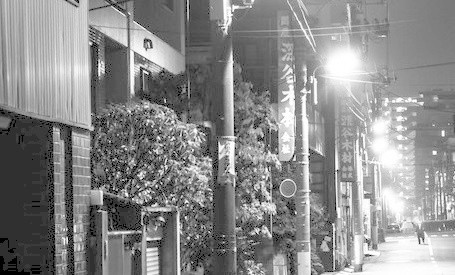
gamma=0.3 の場合
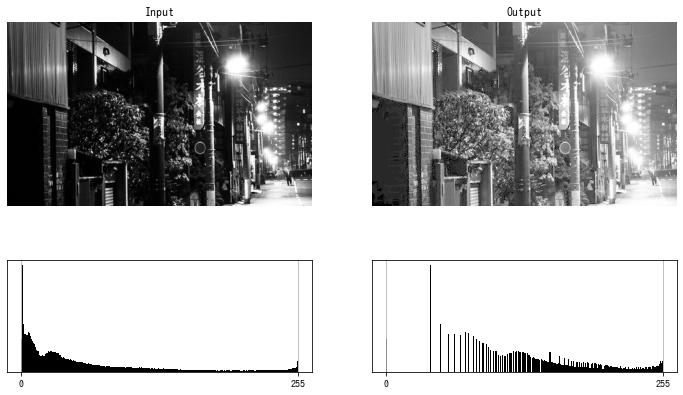
gamma=3 の場合
S 字型トーンカーブ
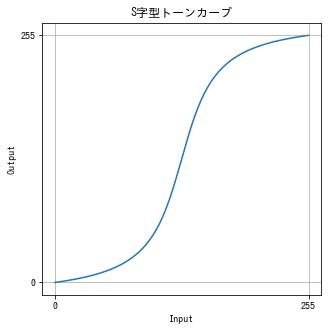
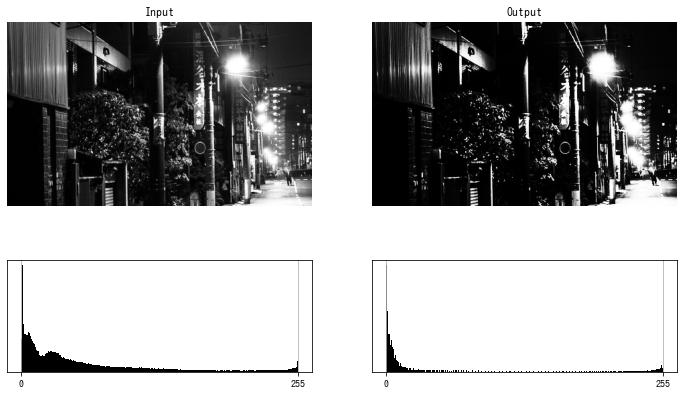
S 字型のトーンカーブで階調変換すると、暗い部分は更に暗く、明るい部分は更に明るくすることができます。
以下の例では、$\arctan(x), x \in [-5, 5]$ の値を $[0, 255]$ にスケールすることで S 字型のトーンカーブを作成しました。
def s_curve(img):
    y = np.arctan(np.linspace(-5, 5, 256))
    y = 255 / (y.max() - y.min()) * (y - y.max()) + 255

    dst = cv2.LUT(img, y).astype(np.uint8)

    return dst


img = cv2.imread("sample2.jpg", cv2.IMREAD_GRAYSCALE)

dst = s_curve(img)
imshow(dst)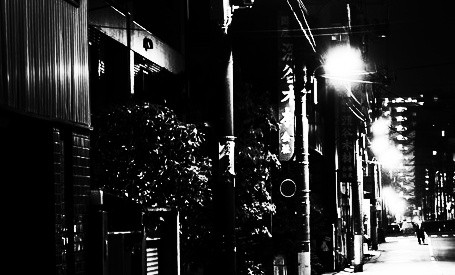




コメント