
目次
概要
離散確率分布の1つであるベルヌーイ分布について解説します。
確率関数
確率変数 $X$ が次のような確率関数をもつとき、$X$ はパラメータ $p, (0 \le p \le 1)$ のベルヌーイ分布 (Bernoulli distribution) に従うという。
$$ f_X(x) = \begin{cases} p^x (1 – p)^{1 – x} & x = 0, 1 \\ 0 & その他の場合 \end{cases} $$確率関数である
$$ f_X(x) = \begin{cases} 1 – p & x = 0 \\ p & x = 1 \\ 0 & その他の場合 \end{cases} $$より、$f_X(x) \in [0, 1], \sum_x f_X(x) = 1$ は明らか。
解釈
事象 $A$ が起こる確率を $p$ とする。 事象 $A$ が起こった場合に1、起こらなかった場合に0をとる確率変数 $X$ をとると、$X$ はパラメータ $p$ のベルヌーイ分布に従う。
累積確率関数
$$ \begin{aligned} P(X \le x) &= \sum_{k = 0}^{\lfloor x \rfloor} p^k (1 – p)^{1 – k} \\ &= \begin{cases} 0 & x < 0 \\ 1 – p & 0 \le x \le 1 \\ 1 & x > 1 \end{cases} \end{aligned} $$$k$ 次の積率
$$ \begin{aligned} E(X^k) &= \sum_{x = 0, 1} x^k p^x (1 – p)^{1 – x} \\ &= 0^k p^0 (1 – p)^{1 – 0} + 1^k p^1 (1 – p)^{1 – 1} \\ &= p \end{aligned} $$期待値
$$ E[X] = p $$分散
$$ Var[X] = E[X^2] – (E[X])^2 = p – p^2 = p (1 – p) $$標準偏差
$$ Std[X] = \sqrt{Var[X]} = \sqrt{p (1 – p)} $$積率母関数
$$ \begin{aligned} m_X(t) &= E[e^{Xt}] \\ &= \sum_{x = 0, 1} e^{xt} p^x (1 – p)^{1 – x} \\ &= e^{0 \cdot t} p^0 (1 – p)^{1 – 0} + e^{1 \cdot t} p^1 (1 – p)^{1 – 1} \\ &= 1 – p + p e^t \end{aligned} $$scipy.stats のベルヌーイ分布
scipy.stats.bernoulli でベルヌーイ分布に従う確率変数を作成できます。
In [1]:
import numpy as np
import seaborn as sns
from matplotlib import pyplot as plt
from scipy.stats import bernoulli

sns.set(style="white")

X = bernoulli(p=0.3)
サンプリング
In [2]:
x = X.rvs(size=5)
print(x)
[1 1 1 0 0]
確率質量関数
In [3]:
x = [0, 1]
y = X.pmf(x)

fig, ax = plt.subplots()
ax.stem(x, y, use_line_collection=True)
ax.set_xlim(-0.1, 1.1)
ax.set_ylim(-0.1, 1.1)
ax.grid()

plt.show()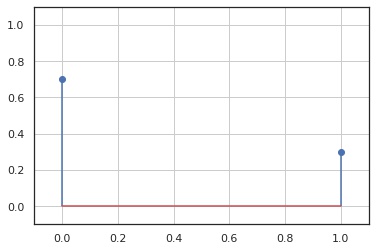
累積分布関数
In [4]:
x = np.linspace(-0.1, 1.1, 100)
y = X.cdf(x)

fig, ax = plt.subplots()
ax.step(x, y)
ax.set_xlim(-0.1, 1.1)
ax.set_ylim(-0.1, 1.1)
ax.grid()

plt.show()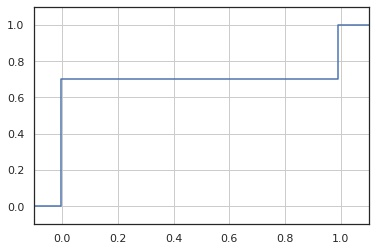
統計量
In [5]:
print("mean", X.mean())
print("var", X.var())
print("std", X.std())
mean 0.3 var 0.21 std 0.458257569495584
コメント