目次
概要
連続確率分布の1つであるコーシー分布について解説します。
確率密度関数
確率変数 $X$ が次のような確率密度関数をもつとき、$X$ はパラメータ $x_0, \gamma$ のコーシー分布 (Cauchy distribution) に従うという。
$$ f_X(x) = \frac{1}{\pi} \frac{\gamma}{(x – x_0)^2 + \gamma^2} $$ただし、$x_0$ は位置パラメータ、$\gamma > 0$ は尺度母数である。 $x_0 = 0, \gamma = 1$ のとき、標準コーシー分布という。
$$ f_X(x) = \frac{1}{\pi (x^2 + 1)} $$確率密度関数である
$$ \begin{aligned} & \int_{-\infty}^{\infty} \frac{1}{\pi} \frac{\gamma}{(x – x_0)^2 + \gamma^2} dx \\ &= \frac{\gamma}{\pi} \int_{-\infty}^{\infty} \frac{1}{t^2 + \gamma^2} dt \quad \because t = x – x_0 で置換積分 \\ &= \frac{\gamma}{\pi} \frac{\pi}{\gamma} \quad \because 積分1 \\ &= 1 \end{aligned} $$積分1の導出 Integral Calculator • With Steps!
また、$f_X(x) \ge 0$ は明らか。
累積確率関数
$$ \begin{aligned} P(X \le x) &= \int_{-\infty}^x \frac{1}{\pi} \frac{\gamma}{(t – x_0)^2 + \gamma^2} dt \\ &= \frac{\gamma}{\pi} \int_{-\infty}^{x – x_0} \frac{1}{u^2 + \gamma^2} du \quad \because u = t – x_0 で置換積分 \\ &= \frac{\gamma}{\pi} \frac{1}{\gamma} \left( \arctan \left( \frac{x – x_0}{\gamma} \right) + \frac{\pi}{2} \right) \quad \because 積分1 \\ &= \frac{1}{\pi} \arctan \left( \frac{x – x_0}{\gamma} \right) + \frac{1}{2} \end{aligned} $$積分1の導出 Integral Calculator • With Steps!
期待値
$$ \begin{aligned} E[X] &= \int_{-\infty}^{\infty} x f_X(x) dx \\ &= \int_{-\infty}^{\infty} x_0 f_X(x) dx + \int_{-\infty}^{\infty} (x – x_0) f_X(x) dx \\ &= x_0 + \int_{-\infty}^{\infty} (x – x_0) f_X(x) dx \\ &= x_0 + \frac{\gamma}{\pi} \int_{-\infty}^{\infty} \frac{x – x_0}{(x – x_0)^2 + \gamma^2} dx \\ &= x_0 + \frac{\gamma}{\pi} \int_{-\infty}^{\infty} \frac{t}{1 + t^2} dt \quad \because t = \frac{1}{\gamma} (x – x_0) \\ &= x_0 + \lim_{R_1, R_2 \to \infty} \frac{\gamma}{\pi} \int_{-R_1}^{R_2} \frac{t}{1 + t^2} dt \\ &= x_0 + \lim_{R_1, R_2 \to \infty} \frac{\gamma}{2 \pi} \log \frac{R_2^2 + 1}{R_1^2 + 1} \quad \because 積分1 \\ \end{aligned} $$ここで、
$$ \lim_{R_1, R_2 \to \infty} \log \frac{R_2^2 + 1}{R_1^2 + 1} $$は極限が存在しないので、$E[X]$ は定義されない。
積分1の導出 Integral Calculator • With Steps!
分散
期待値が定義されないので、分散も定義されない
標準偏差
期待値が定義されないので、標準偏差も定義されない
scipy.stats のコーシー分布
scipy.stats.cauchy でコーシー分布に従う確率変数を作成できます。
In [1]:
import numpy as np
import seaborn as sns
from matplotlib import pyplot as plt
from scipy.stats import cauchy, norm

sns.set(style="white")

X = cauchy(loc=0, scale=1)
サンプリング
In [2]:
x = X.rvs(size=5)
print(x)
[ 6.88852887e-01 1.63192866e-03 -1.39746430e-01 -1.66039028e+00 2.34561191e+00]
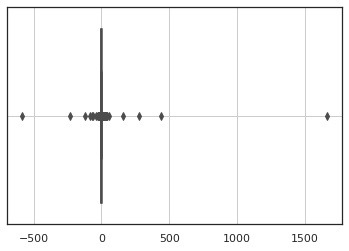
1000個サンプリングした結果を描画します。 図を見るとわかりますが、大半は $0$ 近辺の値となっていますが、まれに大きな外れ値が発生しています。これはコーシー分布が正規分布より裾野が広いために発生しています。
In [3]:
x = X.rvs(size=1000, random_state=0)
ax = sns.boxplot(x)
ax.grid()
確率密度関数
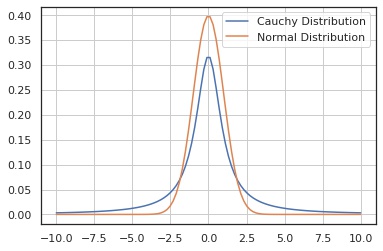
比較するために正規分布も合わせて描画しました。
In [4]:
x = np.linspace(-10, 10, 100)
y1 = X.pdf(x)
y2 = norm.pdf(x)

fig, ax = plt.subplots()
ax.plot(x, y1, label="Cauchy Distribution")
ax.plot(x, y2, label="Normal Distribution")
ax.legend()
ax.grid()

plt.show()
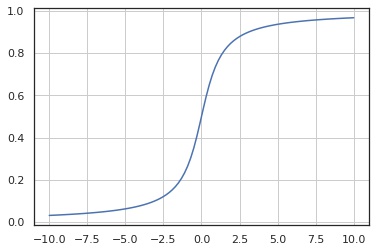
累積分布関数
In [5]:
x = np.linspace(-10, 10, 100)
y = X.cdf(x)

fig, ax = plt.subplots()
ax.plot(x, y)
ax.grid()

plt.show()
統計量
期待値、分散、標準偏差は定義されないので、NaN を返します。
In [6]:
print("mean", X.mean())
print("var", X.var())
print("std", X.std())
mean nan var nan std nan
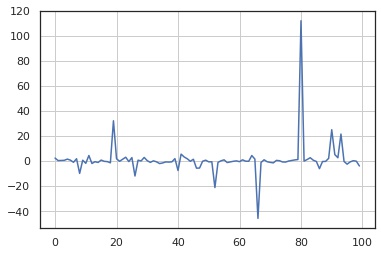
サンプル数 $N$ を増やした場合の標本平均の値を描画します。 図を見るとわかりますが、$N$ を増やしても外れ値の影響で標本平均が収束しないことがわかります。
In [7]:
np.random.seed(0)

means = []
for n in np.linspace(10, 100000, 100):
    x = X.rvs(size=10000)
    means.append(x.mean())

fig, ax = plt.subplots()
ax.plot(means)
ax.grid()


コメント