目次
概要
Pillow (PIL) で画像のヒストグラムを作成する方法について解説します。
Image.histogram
hist = Image.histogram(mask=None, extrema=None)集計はチャンネルごとに行われ、返り値は 256 * チャンネル数 の1次元配列となっています。
例えば、チャンネルが RGB である場合、[R の値が0の数, R の値が1の数, ..., R の値が255の数, G の値が0の数, ...] が返り値となります。
引数
| 名前 | 型 | デフォルト値 |
|---|---|---|
| mask | PIL.Image (mode=”1″ または mode=”L”) | None |
| 集計対象の画素を定義するマスク。マスクの値が0でない要素のみ集計対象となる。 | ||
返り値
| 名前 | 説明 |
|---|---|
| list | ヒストグラム |

In [1]:
import matplotlib.pyplot as plt
import numpy as np
from PIL import Image
# 画像を読み込む。
img = Image.open("sample.jpg")
# チャンネル一覧を取得する。
channels = img.getbands()
print(channels) # ('R', 'G', 'B')
# ヒストグラムを作成する。
hist = img.histogram()
# 各チャンネルごとにヒストグラムを分割する。
hists = np.split(np.array(hist), len(channels))
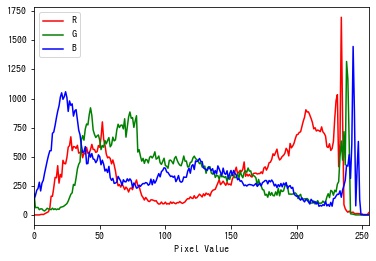
# 描画する。
fig, ax = plt.subplots()
for hist, ch in zip(hists, channels):
ax.plot(hist, color=ch.lower(), label=ch)
ax.set_xlim(0, 255)
ax.set_xlabel("Pixel Value")
ax.legend()
plt.show()('R', 'G', 'B')
コメント