概要
Pillow を使用して、画像上に物体検出の結果を矩形およびラベルで描画する方法について解説します。 この方法は、ディープラーニングの物体検出モデルの推論結果や OpenCV のカスケード検出器による人検出の結果を可視化するのに役立ちます。
物体検出の結果を描画する

以下のような形式の dict の list で物体検出の結果が得られているとします。
class: ラベルscore: スコアx1, y1: 矩形の左上の座標x2, y2: 矩形の右下の座標
detection = [
    {
        "class": "bicycle",
        "score": 0.99,
        "x1": 103,
        "y1": 75,
        "x2": 367,
        "y2": 287,
    },
    {
        "class": "truck",
        "score": 0.92,
        "x1": 310,
        "y1": 56,
        "x2": 448,
        "y2": 110,
    },
    {
        "class": "dog",
        "score": 0.99,
        "x1": 82,
        "y1": 145,
        "x2": 204,
        "y2": 349,
    },
]
draw_boxes(img, detection, class_names) は、検出結果を画像に描画するための関数です。
imgには画像を表すPIL.Imageオブジェクトを指定します。detectionには前述の検出結果のリストを渡します。class_namesにはすべてのクラス名の一覧を指定します。
import matplotlib as mpl
from PIL import Image, ImageDraw, ImageFont


def draw_boxes(img, detection, class_names):
    """
    Draws bounding boxes and labels on an image for object detection results.
    Args:
        img (PIL.Image.Image): The image on which to draw the bounding boxes.
        detection (list of dict): A list of dictionaries containing detection results.
                                  Each dictionary should have keys "class", "x1", "y1", "x2", "y2",
                                  and optionally "score".
        class_names (list of str): A list of class names corresponding to the detected objects.
    Returns:
        PIL.Image.Image: The image with bounding boxes and labels drawn on it.
    """
    draw = ImageDraw.Draw(img, mode="RGBA")

    # クラスごとに色の一覧を作成する。
    cmap = mpl.colormaps["hsv"].resampled(len(class_names) + 1)

    # フォントを作成する。
    fontsize = max(15, int(0.03 * min(img.size)))
    fontname = "DejaVuSerif"  # Windows の場合は "Meiryo" などに変更する。
    font = ImageFont.truetype(fontname, size=fontsize)

    for bbox in detection:
        # 色を取得する。
        class_id = class_names.index(bbox["class"])
        color = cmap(class_id, bytes=True)

        # ラベル
        caption = bbox["class"]
        if "score" in bbox:
            caption += f" {bbox['score']:.0%}"  # "score" が存在する場合はパーセントで表示する。

        # 矩形を描画する。
        draw.rectangle(
            (bbox["x1"], bbox["y1"], bbox["x2"], bbox["y2"]), outline=color, width=3
        )

        # ラベルを描画する。
        textbox = draw.textbbox((bbox["x1"], bbox["y1"]), caption, font=font)
        draw.rectangle(textbox, fill=color)
        draw.text((bbox["x1"], bbox["y1"]), caption, fill="black", font=font)

    return img


# 画像を読み込む。
img = Image.open("sample1.jpg")

# すべてのクラスの一覧
class_names = ["bicycle", "truck", "car", "dog"]

# 矩形を描画する。
img = draw_boxes(img, detection, class_names)

img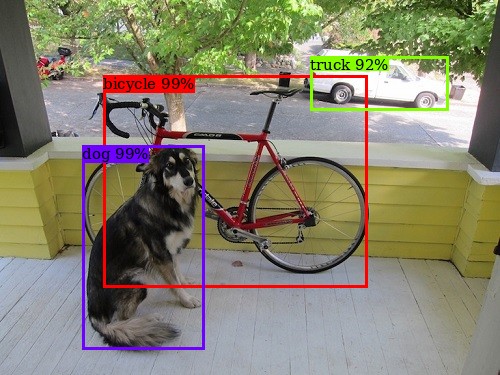
解説
色の一覧
N 種類の色の一覧が欲しい場合、Matplotlib のカラーマップが便利です。
matplotlib.colormaps[{カラーマップ名}].resampled(N) により、指定したカラーマップに基づいて N 種類の色を作成できます。
区別がつきやすい色の一覧を作成するためには、hsv カラーマップがおすすめです。
hsv 色空間では、hue=0 と hue=255 は同じ色となり区別がつかなくなってしまうため、N+1 として 1 個多く色を作成しています。
カラーマップから i 番目の RGB 値を取得するには、cmap(i, bytes=True) を呼び出します。
cmap = mpl.colormaps["hsv"].resampled(len(class_names) + 1)
print(cmap(1, bytes=True))
print(cmap(2, bytes=True))
(133, 255, 0, 255) (0, 255, 243, 255)
| クラス ID | 色 (RGB) | |
|---|---|---|
| 0 | (255, 0, 0) | |
| 1 | (133, 255, 0) | |
| 2 | (0, 255, 243) | |
| 3 | (109, 0, 255) | |
| 4 | (255, 0, 23) | |
テキストの描画
Pillow でテキストを描画するには、まず ImageFont.truetype({フォント名}, size={フォントサイズ}) を使用してフォントオブジェクトを作成します。フォント名には、その環境で利用できるフォントを指定します。日本語を描画したい場合は、日本語フォントを指定する必要があります。フォントサイズは画像の大きさに合わせて調整します。テキストは text() メソッドを使用して描画できます。
# フォントを作成する。
fontsize = max(15, int(0.03 * min(img.size)))
fontname = "DejaVuSerif-Bold"  # 適当なものに変える
font = ImageFont.truetype(fontname, size=fontsize)
矩形の描画
Pillow では、矩形は rectangle() で描画できます。
矩形自体は塗りつぶしなしで描画し、テキストの背景は塗りつぶして描画しています。
テキストの描画範囲は draw.textbbox((x, y), caption, font=font) で取得できます。
背景色に応じて、文字の色を変える
矩形の色によっては黒いテキストが見づらいかもしれません。その改善策として、背景の色に応じて、黒と白のテキストの色を自動で切り替えるようにします。一般に、背景の輝度値が高い場合は黒い文字が見やすく、逆に低い場合は白い文字が見やすくなります。RGB から輝度値は以下の式で計算できます。
$$ \text{brightness} = R * 0.299 + G * 0.587 + B * 0.114 $$brightness の値が適当な閾値より大きい場合は背景が明るいと見なし、文字色を黒にします。逆に閾値以下の場合は背景が暗いと見なし、文字色を白にします。
from matplotlib import pyplot as plt
from PIL import Image, ImageDraw, ImageFont


def get_text_color(color):
    r, g, b, a = color
    brightness = r * 0.299 + g * 0.587 + b * 0.114
    return "black" if brightness > 180 else "white"


import matplotlib as mpl
from PIL import Image, ImageDraw, ImageFont


def draw_boxes(img, detection, class_names):
    """
    Draws bounding boxes and labels on an image for object detection results.
    Args:
        img (PIL.Image.Image): The image on which to draw the bounding boxes.
        detection (list of dict): A list of dictionaries containing detection results.
                                  Each dictionary should have keys "class", "x1", "y1", "x2", "y2",
                                  and optionally "score".
        class_names (list of str): A list of class names corresponding to the detected objects.
    Returns:
        PIL.Image.Image: The image with bounding boxes and labels drawn on it.
    """
    draw = ImageDraw.Draw(img, mode="RGBA")

    # クラスごとに色の一覧を作成する。
    cmap = mpl.colormaps["hsv"].resampled(len(class_names) + 1)

    # フォントを作成する。
    fontsize = max(15, int(0.03 * min(img.size)))
    fontname = "DejaVuSerif"  # Windows の場合は "Meiryo" などに変更する。
    font = ImageFont.truetype(fontname, size=fontsize)

    for bbox in detection:
        # 色を取得する。
        class_id = class_names.index(bbox["class"])
        color = cmap(class_id, bytes=True)

        # ラベル
        caption = bbox["class"]
        if "score" in bbox:
            caption += f" {bbox['score']:.0%}"  # "score" が存在する場合はパーセントで表示する。

        # 矩形を描画する。
        draw.rectangle(
            (bbox["x1"], bbox["y1"], bbox["x2"], bbox["y2"]), outline=color, width=3
        )

        # ラベルを描画する。
        textbox = draw.textbbox((bbox["x1"], bbox["y1"]), caption, font=font)
        draw.rectangle(textbox, fill=color)
        text_color = get_text_color(color)
        draw.text((bbox["x1"], bbox["y1"]), caption, fill=text_color, font=font)

    return img


# 画像を読み込む。
img = Image.open("sample1.jpg")

# すべてのクラスの一覧
class_names = ["bicycle", "truck", "car", "dog"]

# 矩形を描画する。
img = draw_boxes(img, detection, class_names)

img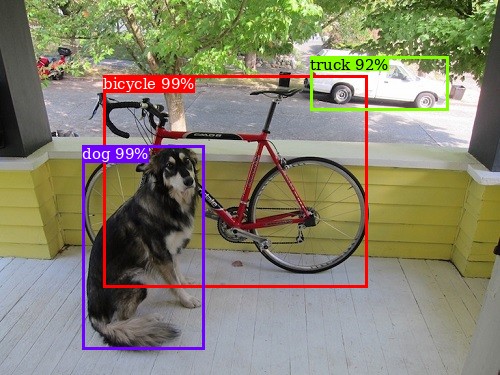
コメント
コメント一覧 (2件)
大変参考になりました。物体検出の研究の助けになりました。
一つ引っかかった点がございまして、最新のPillowのバージョンだとImageDrawのtextsizeは動作しないようです。加えて、この場合はtextbboxを使用するそうです。
参考にしたページ:
https://qiita.com/mo256man/items/f07bffcf1cfedf0e42e0
ご指摘いただきありがとうございます。
Pillow および matplotlib の関数で一部 API が変更になったようでしたので、コードを更新しました。