
概要
コピペするだけで matplotlib を日本語化する方法について紹介します。 matplotlib の日本語化のやり方に関する情報は Web 上に沢山ありますが、環境を作り直すたびに手動で設定するのが面倒なので、コピペするだけで日本語化ができるコードを紹介します。
Windows 10 と Ubuntu 16.04/18.04 で動作することを確認しています。
デフォルトでは日本語は描画できない
matplotlib のデフォルトのフォントは英字フォントのため、日本語を描画しようとすると、RuntimeWarning: Glyph <番号> missing from current font. という警告が表示され、以下のように □ で表示されてしまいます。
日本語フォントを設定する手順
日本語を表示するには、次の手順で、使用するフォントに日本語フォントを設定する必要があります。
- テンプレートの設定ファイル
<モジュールのパス>/mpl-data/matplotlibrcを<ホームディレクトリ>/.config/matplotlib/matplotlibrcにコピーする。 - 設定ファイル
matplotlibrcをテキストエディタで開き、font.family : <使用するフォント名>を記載する。 - matplotlib のフォントのキャッシュを削除する。
今回は上記作業を Python で自動化してみました。
Windows の場合
以下のコードをコピペして、実行してください。
Windows 10 に搭載されている UDデジタル教科書体 N-R に設定するようになっていますが、他のフォントを設定したい場合は、fontname = "UD Digi Kyokasho N-R" の行を変更してください。
import re
import shutil
import subprocess
from pathlib import Path

import matplotlib as mpl
import matplotlib.pyplot as plt  # これを呼ばないと matplotlib.font_manager にアクセスできない

print("Clearing cache...")
mpl.font_manager._rebuild()  # matplotlib のフォントキャッシュを更新する。

# 設定ファイルをコピーする。
config_dir = Path(mpl.get_configdir())
config_dir.mkdir(exist_ok=True, parents=True)

default_config_path = Path(mpl.__file__).parent / "mpl-data/matplotlibrc"
config_path = config_dir / "matplotlibrc"
if not config_path.exists():
    print(f"Copying config file {default_config_path} to {config_path}")
    shutil.copyfile(default_config_path, config_path)
else:
    print(f"{config_path} already exists.")

with open(config_path, "r") as f:
    config = f.read()

# フォントを変更する。
fontname = "UD Digi Kyokasho N-R"
config, cnt = re.subn(
    r".*font\.family\s*:\s*.+", f"font.family: {fontname}", config, re.MULTILINE
)

if cnt:
    print("`font.family` changed successfully.")
    with open(config_path, "w") as f:
        f.write(config)
else:
    print("Failed to modify `font.family` in config file.")
Ubuntu の場合
IPAフォント をインストールします。
sudo apt-get update
sudo apt-get install -y fonts-ipafont
rm -rf ~/.cache/matplotlib
デフォルトの設定ファイルを ~/.config/matplotlib/matplotlibrc にコピーします。
import shutil
from pathlib import Path

import matplotlib as mpl

# 設定ファイルをコピーする。
config_dir = Path(mpl.get_configdir())
config_dir.mkdir(exist_ok=True, parents=True)

default_config_path = Path(mpl.__file__).parent / "mpl-data/matplotlibrc"
config_path = config_dir / "matplotlibrc"
shutil.copyfile(default_config_path, config_path)
設定ファイルのフォントを変更します。
sed -i "s/#font.family: sans-serif/font.family: IPAGothic/" ~/.config/matplotlib/matplotlibrc使用可能なフォント名の確認方法
以下のコードで使用可能なフォント名を確認できます。
matplotlibrc に記載する場合、フォント名が空白を含む場合も、引用符で囲う必要はありません。
font.family : Noto Sans CJK JP  # OK
font.family : "Noto Sans CJK JP" # NGimport matplotlib as mpl
import matplotlib.pyplot as plt # これを呼ばないと matplotlib.font_manager にアクセスできない
def show_avaiable_fonts():
print("Avaiable fonts:")
for font in mpl.font_manager.findSystemFonts():
fontname = mpl.font_manager.FontProperties(fname=font).get_name()
print(f"* {fontname}")
# 利用可能なフォントを表示する。
show_avaiable_fonts()Avaiable fonts: * Liberation Sans Narrow * Liberation Sans * IPAMincho * Liberation Sans Narrow * IPAGothic * IPAGothic * Liberation Mono * DejaVu Serif * Liberation Sans Narrow * Liberation Serif * DejaVu Sans * Liberation Sans * Liberation Sans * DejaVu Serif * DejaVu Sans Mono * Liberation Sans * Liberation Serif * DejaVu Sans Mono * Liberation Mono * Liberation Sans Narrow * Liberation Serif * IPAMincho * Liberation Mono * Liberation Mono * Liberation Serif * IPAPMincho * DejaVu Sans * IPAPGothic
日本語化ができたかどうかを確認する。
以下のコードを実行し、日本語が描画できる事を確認します。
Jupyter Notebook / Jupyter Lab の場合、設定ファイルが読み込まれるのは import matplotlib.pyplot を実行したタイミングなので、一度カーネルを再起動してください。
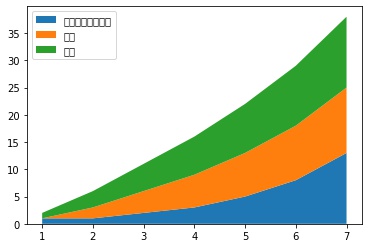
import numpy as np
import matplotlib.pyplot as plt

x = [1, 2, 3, 4, 5, 6, 7]
y1 = [1, 1, 2, 3, 5, 8, 13]
y2 = [0, 2, 4, 6, 8, 10, 12]
y3 = [1, 3, 5, 7, 9, 11, 13]

y = np.vstack([y1, y2, y3])

fig, ax = plt.subplots()
ax.stackplot(x, y1, y2, y3, labels=["フィボナッチ数列", "偶数", "奇数"])
ax.legend(loc=2)
plt.show()
日本語を正しく表示できることが確認できました。
コメント