
目次
概要
matplotlib で1つの図に複数のグラフを作成するとき、引数 sharex, sharey を指定して、x 軸、y 軸を複数のグラフで共有する方法について紹介します。
pyplot.subplots, Figure.subplots の引数で指定する
x 軸を共有するかどうかを指定する
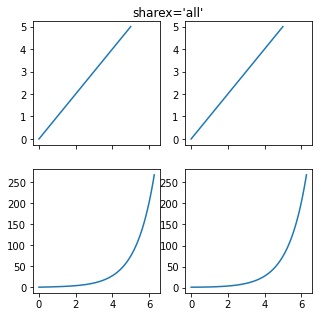
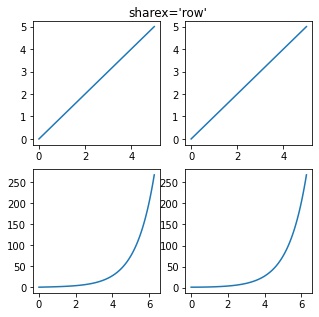
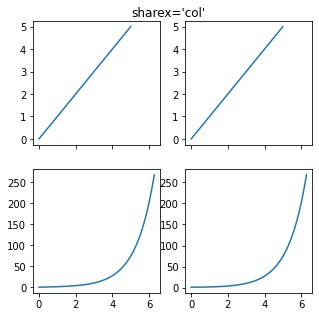
pyplot.subplots() または Figure.subplots() で格子状に複数のグラフを作成する際に、引数 sharex で x 軸を共有するかどうかを次の値から指定できます。
- False /
"none": x 軸を共有しない。 - True /
"all"すべてのグラフで x 軸を共有する。 "col": 同じ列のグラフで x 軸を共有する。

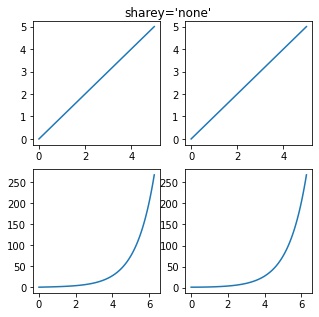
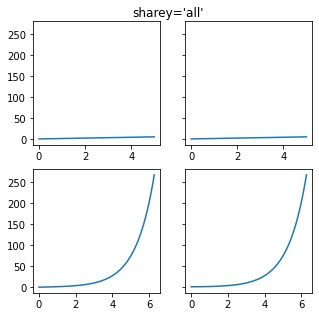
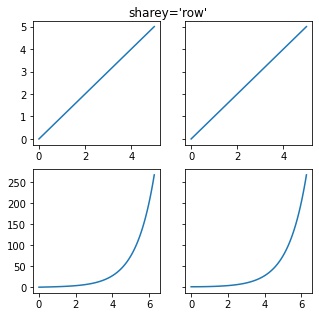
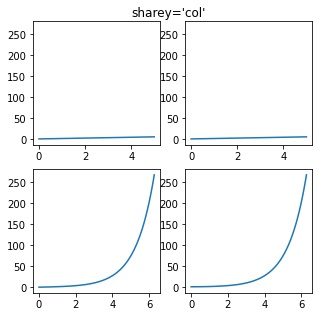
y 軸を共有するかどうかを指定する
pyplot.subplots() または Figure.subplots() で格子状に複数のグラフを作成する際に、引数 sharey で y 軸を共有するかどうかを次の値から指定できます。
- False /
"none": y 軸を共有しない。 - True /
"all"すべてのグラフで y 軸を共有する。 "row": 同じ行のグラフで y 軸を共有する。
サンプルコードを以下に示します。
In [1]:
import matplotlib.pyplot as plt
import numpy as np

x1 = np.linspace(0, 5, 100)
x2 = np.linspace(0, np.pi * 2, 100)

fig, ax = plt.subplots(2, 2, sharex="all", figsize=(6, 6), facecolor="w")
ax[0, 0].plot(x1, x1)
ax[0, 1].plot(x1, np.abs(x1))
ax[1, 0].plot(x2, np.sinh(x2))
ax[1, 1].plot(x2, np.cosh(x2))

plt.show()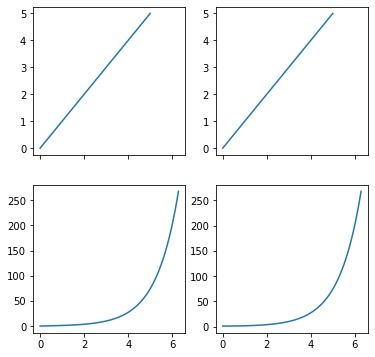
pyplot.subplot, Figure.add_subplot の引数で指定する
pyplot.subplot() または Figure.add_subplot() でグラフを作成するとき、sharex, sharey 引数に x 軸、y 軸を共有する Axes を指定します。 sharex, sharey の指定方法は subplots() の場合と同じです。
In [2]:
import matplotlib.pyplot as plt
import numpy as np

x = np.linspace(0, np.pi * 4)

fig = plt.figure()
ax1 = fig.add_subplot(211)
ax1.plot(x, np.sin(x))

# ax1 と x 軸、y 軸を共有する。
ax2 = fig.add_subplot(212, sharex=ax1, sharey=ax1)
ax2.plot(x, np.cos(x))

plt.show()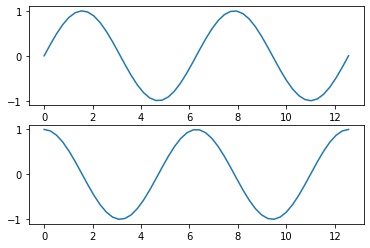
コメント