
概要
matplotlib の pyplot.text(), pyplot.annotate() を使用して、図中にテキストを追加する方法を解説します。
pyplot.text
pyplot.text() は Axes 中の指定した位置にテキストを追加する関数です。
matplotlib.pyplot.text(x, y, s, fontdict=None, withdash=<deprecated parameter>, **kwargs)| 名前 | 型 | デフォルト値 |
|---|---|---|
| x, y | (scalar, scalar) | |
| テキストを表示する位置。デフォルトでは、これはデータの座標系になります。 | ||
| s | str | |
| 表示するテキスト | ||
| fontdict | dict | None |
| テキストの設定。None を指定した場合は、rcParams の設定が使用されます。 | ||
| 名前 | 説明 |
|---|---|
| Text | 作成された Text オブジェクト |
テキストを表示する座標 (x, y) と表示するテキスト s を指定します。
import numpy as np
from matplotlib import pyplot as plt

x = np.linspace(0, 5, 100)
y = np.sin(x)

fig, ax = plt.subplots()
ax.plot(x, y, label="sin")
ax.text(1, 0.5, "text", fontsize="xx-large")
ax.grid()

plt.show()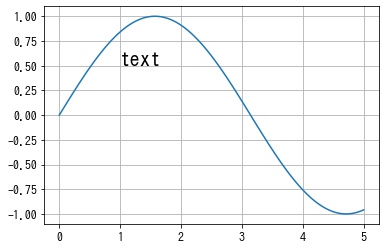
pyplot.annotate
pyplot.annotate() は pyplot.text() と似ていますが、注釈を付ける点とテキストを表示する点を指定し、2点を矢印で結ぶ関数です。

matplotlib.pyplot.annotate(text, xy, *args, **kwargs)| 名前 | 型 | デフォルト値 |
|---|---|---|
| text | str | |
| 注釈のテキスト。 | ||
| xy | (float, float) | |
| 注釈を付ける点 (x, y)。座標系は xycoords で決まります。 | ||
| xytext | (float, float), default: xy | |
| テキストを配置する位置 (x, y)。座標系は textcoords で決まります。 | ||
| xycoords | str or Artist or Transform or callable or (float, float), default: ‘data’ | |
| xy の座標系。 | ||
| textcoords | str or Artist or Transform or callable or (float, float), default: value of xycoords | |
| xytext の座標系。 | ||
| arrowprops | dict | |
| 位置 xy と xytext の間に FancyArrowPatch の矢印を描画するために使用されるプロパティ。 | ||
| annotation_clip | bool or None, default: None | |
| 注釈を付ける点 (x, y) が Axes の領域外にある場合に注釈を描画するかどうか。 | ||
| **kwargs | ||
| Text オブジェクトに渡される追加の引数 | ||
テキストを表示する座標 xytext と矢印で注釈をつける座標 xy、表示するテキスト text を指定します。
デフォルトでは矢印は表示されないので、矢印を表示する場合は arrowprops=dict(arrowstyle="->") も合わせて指定します。
import numpy as np
from matplotlib import pyplot as plt

x = np.linspace(0, 5, 100)
y = np.sin(x)

fig, ax = plt.subplots()
ax.plot(x, y, label="sin")
ax.annotate("text", (1, 0.5), (1.5, 0.7), arrowprops=dict(arrowstyle="->"), fontsize="xx-large")
ax.grid()

plt.show()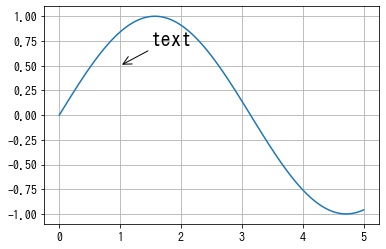
Text のプロパティ
キーワード引数で指定できるテキストの設定項目について紹介します。
テキストの透過度を設定する
alpha で透過度を $[0, 1]$ の float で指定できます。
x = np.linspace(0, 5, 100)
y = np.sin(x)

fig, ax = plt.subplots()
ax.plot(x, y, label="sin")
ax.text(1, 0.5, "text", alpha=0.5)
ax.grid()

plt.show()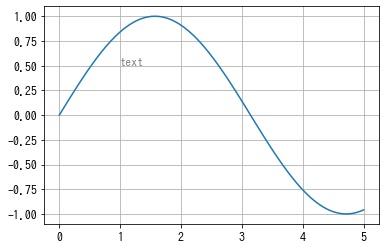
テキストの背景色を設定する
backgroundcolor でテキストの背景色を指定できます。
x = np.linspace(0, 5, 100)
y = np.sin(x)

fig, ax = plt.subplots()
ax.plot(x, y, label="sin")
ax.text(1, 0.5, "text", backgroundcolor="lightblue")
ax.grid()

plt.show()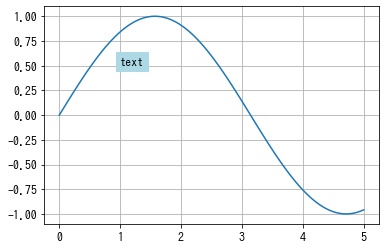
テキストの色を設定する
color でテキストの色を指定できます。
x = np.linspace(0, 5, 100)
y = np.sin(x)

fig, ax = plt.subplots()
ax.plot(x, y, label="sin")
ax.text(1, 0.5, "text", color="red")
ax.grid()

plt.show()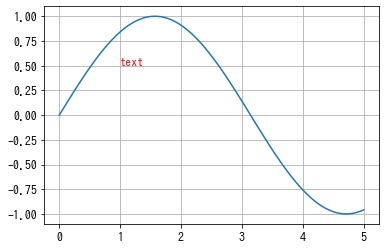
フォントの設定
フォントの一覧を確認する
fontfamily または fontname で使用するフォントを指定できます。
使用可能なフォントの一覧は font_manager.findSystemFonts() で確認できます。
from matplotlib import font_manager as fm

fontnames = [fm.FontProperties(fname=x).get_name() for x in fm.findSystemFonts()]

fig, ax = plt.subplots()
ax.set_axis_off()

for i, name in enumerate(fontnames):
    x, y = 0.1, 0.2 + i * 0.15
    text = f'fontfamily="{name}"'
    ax.text(x, y, text, fontname=name, fontsize="xx-large")

plt.show()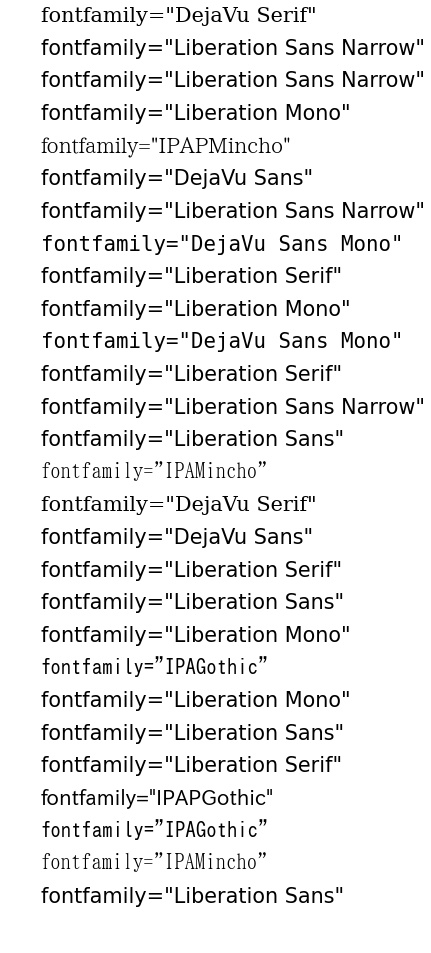
フォントサイズを設定する
fontsize でフォントサイズを指定できる。
- None: デフォルトのフォントサイズ (
plt.rcParams["font.size"]) - int: フォントサイズを pt で指定する。
- str: デフォルトのフォントサイズ (
plt.rcParams["font.size"]) からの相対的な大きさで指定する。
例えば、plt.rcParams["font.size"] = 12 で large を指定した場合、12 * 1.2 = 14.4pt になります。
| 名前 | 倍率 | フォントサイズ (デフォルトが12ptの場合) |
|---|---|---|
| xx-small | 1.2**-3 (=0.58) | 6.95pt |
| x-small | 1.2**-2 (=0.69) | 8.33pt |
| small | 1.2**-1 (=0.83) | 10.00pt |
| medium | 1.2**0 (=1.00) | 12.00pt |
| large | 1.2**1 (=1.20) | 14.40pt |
| x-large | 1.2**2 (=1.44) | 17.28pt |
| xx-large | 1.2**3 (=1.73) | 20.74pt |
x = np.linspace(0, 5, 100)
y = np.sin(x)

fig, ax = plt.subplots()
ax.plot(x, y, label="sin")
ax.text(1, 0.5, "text", fontsize="xx-large")
ax.grid()

plt.show()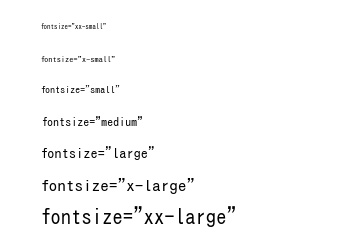
フォントスタイルを設定する
fontstyle でフォントスタイルを指定できます。フォントが対応していれば指定が反映されます。
"normal": 通常"italic": イタリック"oblique": 斜体
x = np.linspace(0, 5, 100)
y = np.sin(x)

fig, ax = plt.subplots()
ax.plot(x, y, label="sin")
ax.text(1, 0.5, "text", fontstyle="italic")
ax.grid()

plt.show()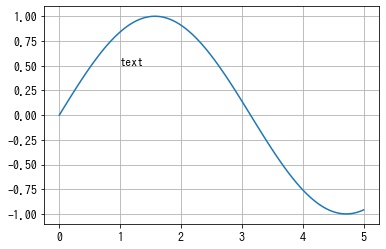
fig, ax = plt.subplots()
ax.invert_yaxis()
ax.set_axis_off()

params = ['normal', 'italic', 'oblique']
for i, p in enumerate(params):
    x, y = 0.1, 0.2 + i * 0.15
    s = "fontstyle=\"{}\"".format(p)
    ax.text(x, y, s, fontstyle=p, fontname='serif', fontsize="xx-large")

plt.show()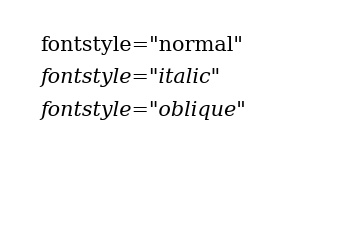
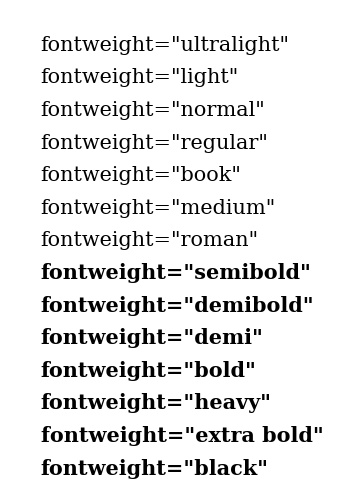
フォントの太さを指定する
fontweight でフォントの太さを指定できます。フォントが対応していれば指定が反映されます。
大抵のフォントは太さのバリエーションは通常と太字の2種類になるので、太字にしたい場合は fontweight="bold" と指定すればよいです。
- int: [0, 1000] の整数
- str: 太さを表す文字列
x = np.linspace(0, 5, 100)
y = np.sin(x)

fig, ax = plt.subplots()
ax.plot(x, y, label="sin")
ax.text(1, 0.5, "text", fontname="serif", fontweight=1000)
ax.grid()

plt.show()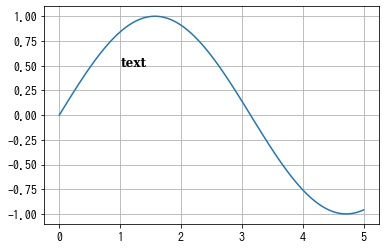
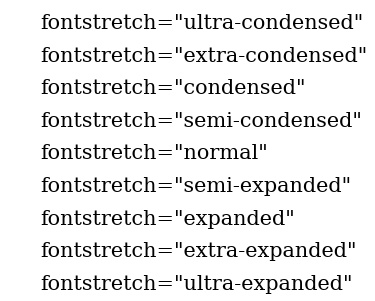
フォントを伸縮を設定する
fontstretch でフォントの伸縮を設定できます。フォントが対応していれば指定が反映されます。
このパラメータに対応しているフォントは少ないと思います。
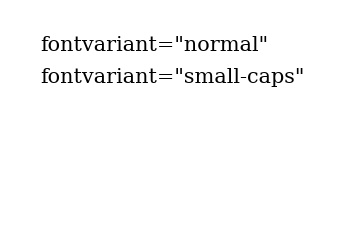
フォントをスモールキャップにするかどうかを設定する
fontvariant でフォントをスモールキャップにするかどうかを設定できます。フォントが対応していれば指定が反映されます。
このパラメータに対応しているフォントは少ないと思います。
複数行の場合の行間を設定する
linespacing でテキストが複数行の場合の行間を指定できます。単位はフォントサイズに対する割合になります。
x = np.linspace(0, 5, 100)
y = np.sin(x)

fig, ax = plt.subplots()
ax.plot(x, y, label="sin")
ax.text(1, 0.5, "aaa\nbbbbbb\nccccccccc", linespacing=2, fontsize="xx-large")
ax.grid()

plt.show()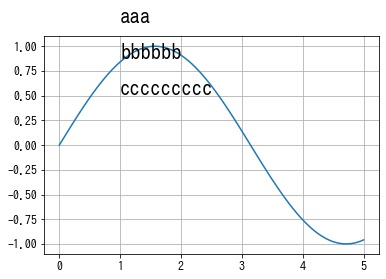
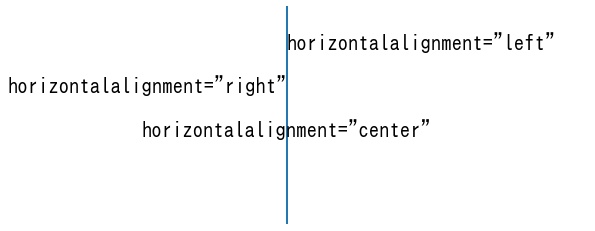
水平方向のアラインメントを設定する
horizontalalignment または ha で位置 (x, y) に対する水平方向のテキストの配置方法を指定できます。
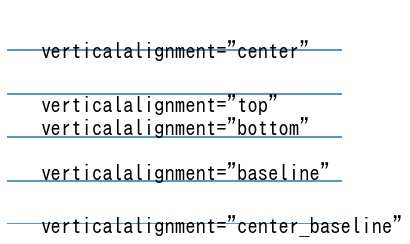
垂直方向のアラインメントを設定する
verticalalignment または va で位置 (x, y) に対する垂直方向のテキストの配置方法を指定できます。

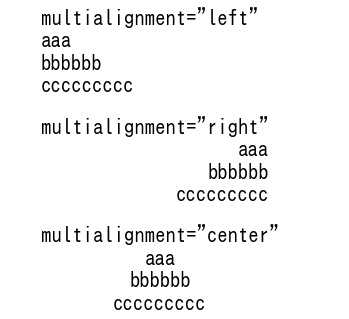
複数行の場合のアラインメントを設定する
multialignment で複数行の場合の水平方向のテキストの配置方法を指定できます。
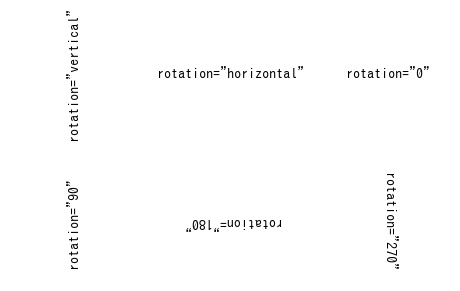
テキストの回転角度を設定する
rotation でテキストの回転角度を指定できます。
x = np.linspace(0, 5, 100)
y = np.sin(x)

fig, ax = plt.subplots()
ax.plot(x, y, label="sin")
ax.text(1, 0.5, "text", rotation=90, fontsize="xx-large")
ax.grid()

plt.show()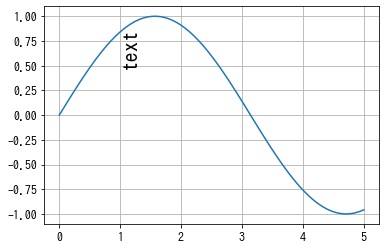
Tex を使う
$ で囲まれたテキストは Tex 記法としてレンダリングされます。
Tex はバックスラッシュから始まるコマンドが多いですが、Python のエスケープが必要な文字なので、r'テキスト' として raw 文字列を使うことをおすすめします。
fig, ax = plt.subplots()
ax.set_axis_off()

s = r"$\nabla^2 =\frac{\partial^2 f}{\partial x^2} + \frac{\partial^2 f}{\partial y^2}$"
ax.text(0.5, 0.5, s, ha="center", fontsize=30)

plt.show()
コメント