
目次
概要
matplotlib で極座標系でプロットする方法について解説します。
座標を極座標系に設定する
pyplot.subplot(), pyplot.add_subplots() など Axes を作成する関数で projection="polar" または polar=True を指定することで、極座標系の図を作成できます。
In [1]:
import numpy as np
from matplotlib import pyplot as plt

theta = [0, 1, 2, 3, 4, 5, 6, 7, 8, 9]
r = [0.11, 0.55, 0.86, 0.45, 0.34, 0.55, 0.78, 0.21, 0.97, 0.25]

fig = plt.figure(figsize=(6, 6))
ax = fig.add_subplot(111, projection="polar")
ax.plot(theta, r, "o")

plt.show()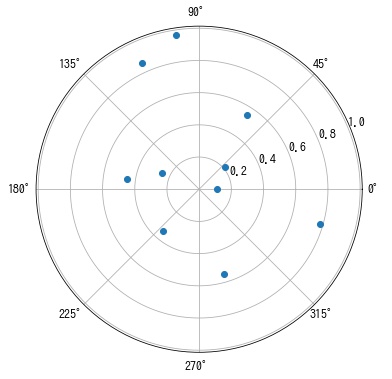
偏角の目盛りを設定する
Axes.set_thetagrids() で偏角の目盛りを設定できます。
In [2]:
import numpy as np
from matplotlib import pyplot as plt

theta = [0, 1, 2, 3, 4, 5, 6, 7, 8, 9]
r = [0.11, 0.55, 0.86, 0.45, 0.34, 0.55, 0.78, 0.21, 0.97, 0.25]

theta_ticks = np.linspace(0, 360, 20)

fig = plt.figure(figsize=(6, 6))
ax = fig.add_subplot(111, projection="polar")
ax.plot(theta, r, "o")
ax.set_thetagrids(theta_ticks, fmt="%.2f")

plt.show()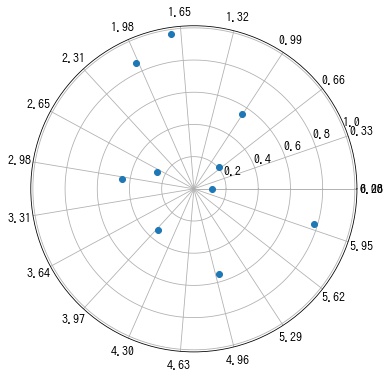
labels 引数も渡すことで、偏角の目盛りのラベルを数値以外に変更できます。
In [3]:
import numpy as np
from matplotlib import pyplot as plt

theta = [0, 1, 2, 3, 4, 5, 6, 7, 8, 9]
r = [0.11, 0.55, 0.86, 0.45, 0.34, 0.55, 0.78, 0.21, 0.97, 0.25]

theta_ticklabels = [
    "E",
    "ENE",
    "NE",
    "NNE",
    "N",
    "NNW",
    "NW",
    "WNW",
    "W",
    "WSW",
    "SW",
    "SSW",
    "S",
    "SSE",
    "SE",
    "ESE",
]
theta_ticks = np.linspace(0, 360, len(theta_ticklabels), endpoint=False)

fig = plt.figure(figsize=(6, 6),)
ax = fig.add_subplot(111, projection="polar")
ax.plot(theta, r, "o")
ax.set_thetagrids(theta_ticks, labels=theta_ticklabels, fontsize=16)

plt.show()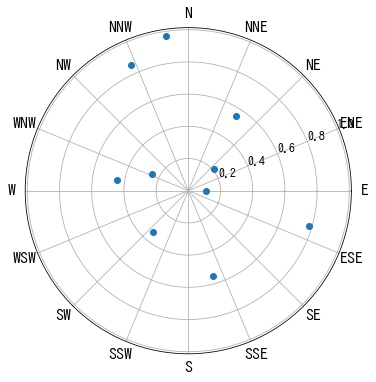
動径の目盛りを設定する
Axes.set_rgrids() で動径の目盛りを設定できます。
In [4]:
import numpy as np
from matplotlib import pyplot as plt

theta = [0, 1, 2, 3, 4, 5, 6, 7, 8, 9]
r = [0.11, 0.55, 0.86, 0.45, 0.34, 0.55, 0.78, 0.21, 0.97, 0.25]

r_ticks = np.linspace(0, 1, 5)

fig = plt.figure(figsize=(6, 6))
ax = fig.add_subplot(111, projection="polar")
ax.plot(theta, r, "o")
ax.set_rgrids(r_ticks, fmt="%.2f")

plt.show()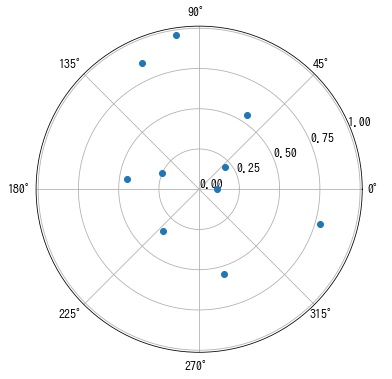
labels 引数も渡すことで、動怪の目盛りのラベルを数値以外に変更できます。
In [5]:
import numpy as np
from matplotlib import pyplot as plt

theta = [0, 1, 2, 3, 4, 5, 6, 7, 8, 9]
r = [0.11, 0.55, 0.86, 0.45, 0.34, 0.55, 0.78, 0.21, 0.97, 0.25]

r_ticks = np.linspace(0, 1, 5)
r_ticklabels = ["A", "B", "C", "D", "E"]

fig = plt.figure(figsize=(6, 6))
ax = fig.add_subplot(111, projection="polar")
ax.plot(theta, r, "o")
ax.set_rgrids(np.linspace(0, 1, 5), labels=r_ticklabels)

plt.show()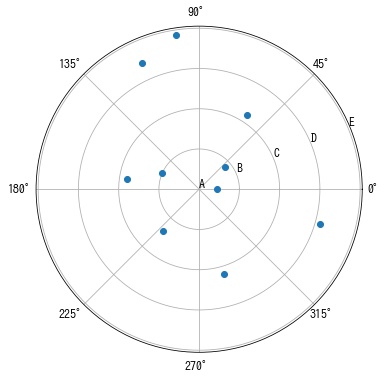
angle で動怪の目盛りを表示する角度を設定できます。
In [6]:
import numpy as np
from matplotlib import pyplot as plt

theta = [0, 1, 2, 3, 4, 5, 6, 7, 8, 9]
r = [0.11, 0.55, 0.86, 0.45, 0.34, 0.55, 0.78, 0.21, 0.97, 0.25]

r_ticks = np.linspace(0, 1, 5)

fig = plt.figure(figsize=(6, 6))
ax = fig.add_subplot(111, projection="polar")
ax.plot(theta, r, "o")
ax.set_rgrids(r_ticks, angle=0)

plt.show()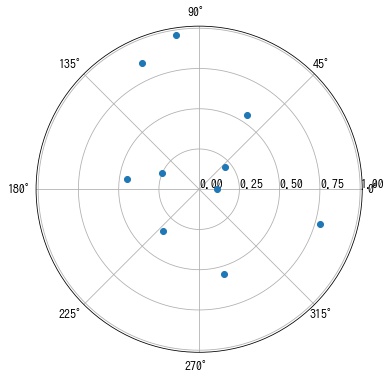
コメント