
目次
概要
matplotlib の pyplot.errorbar() で誤差棒付きの折れ線グラフを作成する方法について解説します。
y 軸方向の誤差棒
yerr=err で各点に [-err, err] の誤差棒を付けられます。
In [1]:
import numpy as np
from matplotlib import pyplot as plt

x = np.linspace(0, np.pi * 4, 20)
y = np.sin(x)

fig, ax = plt.subplots()
ax.errorbar(x, y, yerr=0.1)

plt.show()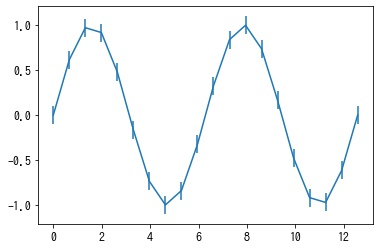
yerr=[err1, err2, ..., errn] で点 xi に [-erri, erri] の誤差棒を付けられます。
In [2]:
import numpy as np
from matplotlib import pyplot as plt

x = np.linspace(0, np.pi * 4, 20)
y = np.sin(x)
yerr = np.random.uniform(0.1, 0.3, len(x))

fig, ax = plt.subplots()
ax.errorbar(x, y, yerr=yerr)

plt.show()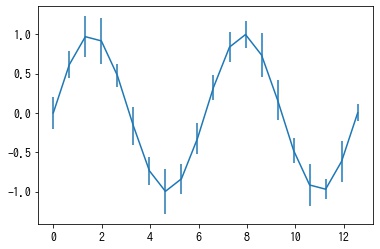
yerr=[[err_min1, err_max1], [err_min2, err_max2], ..., [err_minn, err_maxn]] で点 xi に [err_mini, err_maxi] の誤差棒を付けられます。
In [3]:
import numpy as np
from matplotlib import pyplot as plt

x = np.linspace(0, np.pi * 4, 20)
y = np.sin(x)
yerr = np.random.uniform(0.1, 0.3, (2, len(x)))

fig, ax = plt.subplots()
ax.errorbar(x, y, yerr=yerr)

plt.show()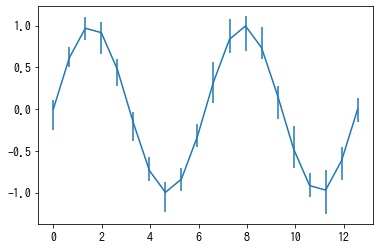
x 軸方向の誤差棒
xerr で x 軸方向に誤差棒を付けられます。
In [4]:
import numpy as np
from matplotlib import pyplot as plt

x = np.linspace(0, np.pi * 4, 20)
y = np.sin(x)

fig, ax = plt.subplots()
ax.errorbar(x, y, xerr=0.5, fmt='o-')

plt.show()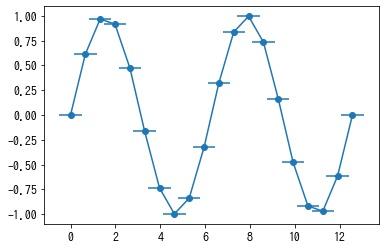
誤差棒のスタイルを設定する
誤差棒の色、太さ、末端のキャップをカスタマイズできます。
ecolor: 誤差棒の色elinewidth: 誤差棒の太さcapsize: 誤差棒のキャップの大きさcapthick: 誤差棒のキャップの太さ
In [5]:
import numpy as np
from matplotlib import pyplot as plt

x = np.linspace(0, np.pi * 4, 20)
y = np.sin(x)

fig, ax = plt.subplots()
ax.errorbar(x, y, yerr=0.1, ecolor="red", elinewidth=1, capsize=4, capthick=3)

plt.show()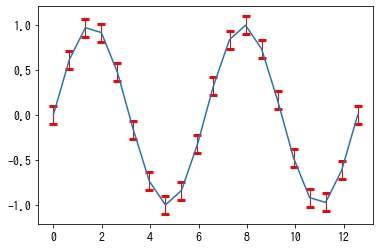
誤差棒に下限、上限が存在しないことを表す矢印を付ける
誤差棒に下限、上限が存在しないことを表す矢印をつけることができます。
lolims: True の場合、y 方向の誤差は下限しか存在しないことを表すため、上限が存在しないことを意味する矢印を +y 方向に付けます。uplims: True の場合、y 方向の誤差は上限しか存在しないことを表すため、下限が存在しないことを意味する矢印を -y 方向に付けます。xlolims: True の場合、x 方向の誤差は下限しか存在しないことを表すため、上限が存在しないことを意味する矢印を +x 方向に付けます。xuplims: True の場合、x 方向の誤差は上限しか存在しないことを表すため、下限が存在しないことを意味する矢印を -x 方向に付けます。
In [6]:
import numpy as np
from matplotlib import pyplot as plt

x = np.linspace(0, np.pi * 4, 20)
y = np.sin(x)

fig, [ax1, ax2] = plt.subplots(1, 2, figsize=(8, 3))
ax1.set_title("lolims=True")
ax1.errorbar(x, y, yerr=0.1, ecolor="red", lolims=True)
ax2.set_title("uplims=True")
ax2.errorbar(x, y, yerr=0.1, ecolor="red", uplims=True)

plt.show()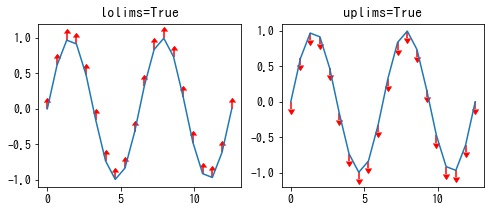
In [7]:
import numpy as np
from matplotlib import pyplot as plt

x = np.linspace(0, np.pi * 4, 20)
y = np.sin(x)

fig, [ax1, ax2] = plt.subplots(1, 2, figsize=(8, 3))
ax1.errorbar(y, x, xerr=0.1, ecolor="red", xlolims=True)
ax1.set_title("xlolims=True")
ax2.errorbar(y, x, xerr=0.1, ecolor="red", xuplims=True)
ax2.set_title("xuplims=True")

plt.show()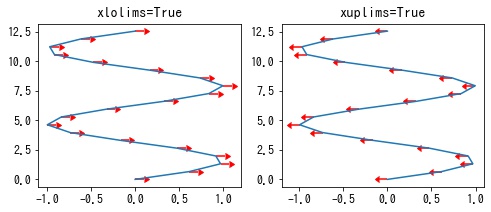
誤差棒を表示する間隔を設定する
errorevery でサンプル点のうち、何個おきに誤差棒を設定するかを指定できます。
In [8]:
import numpy as np
from matplotlib import pyplot as plt

x = np.linspace(0, np.pi * 4, 20)
y = np.sin(x)

fig, ax = plt.subplots()
ax.errorbar(x, y, yerr=0.1, ecolor="red", errorevery=2)

plt.show()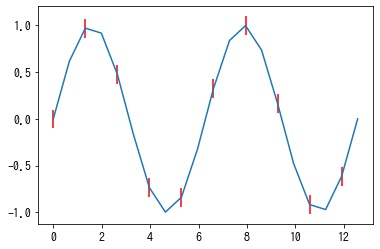
コメント