
目次
概要
matplotlib の pyplot.stackplot() で積み上げ折れ線グラフを作成する方法について紹介します。
pyplot.stackplot
matplotlib.pyplot.stackplot(x, *args, labels=(), colors=None, baseline='zero', data=None, **kwargs)引数
stackplot(x, y1, y2, y3) または stackplot(x, [y1, y2, y3]) で指定します。
また、y1, y2, y3 に対応するラベルは labels 引数で指定できます。
In [1]:
import numpy as np
from matplotlib import pyplot as plt

x = [1, 2, 3, 4, 5]
y1 = [1, 1, 2, 3, 5]
y2 = [0, 4, 2, 6, 8]
y3 = [1, 3, 5, 7, 9]
labels = ["Fibonacci ", "Evens", "Odds"]

fig, ax = plt.subplots()
ax.stackplot(x, y1, y2, y3, labels=labels)
ax.legend(loc="upper left")

fig, ax = plt.subplots()
ax.stackplot(x, [y1, y2, y3], labels=labels)
ax.legend(loc="upper left")

plt.show()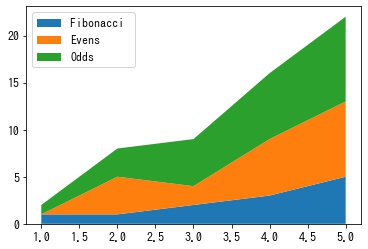
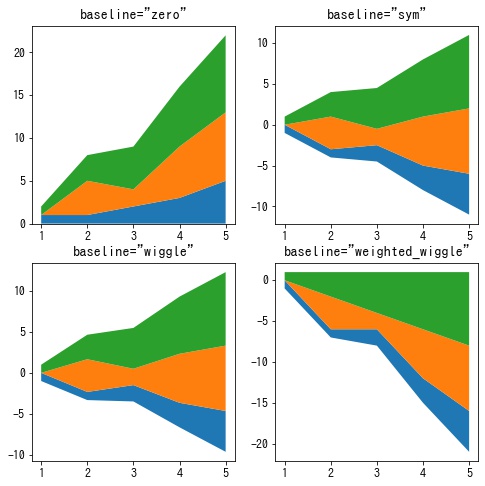
積み上げる際の起点を設定する
baseline 引数でどこを起点に積み上げるかを指定できます。
In [2]:
import numpy as np
from matplotlib import pyplot as plt

x = [1, 2, 3, 4, 5]
y1 = [1, 1, 2, 3, 5]
y2 = [0, 4, 2, 6, 8]
y3 = [1, 3, 5, 7, 9]

fig, ax = plt.subplots()
ax.stackplot(x, y1, y2, y3, baseline="sym")

plt.show()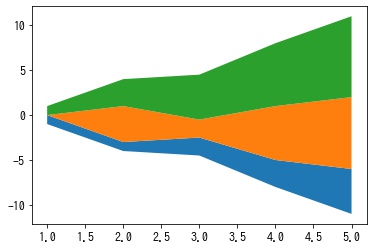
色を設定する
y1, y2, y3 に対応するラベルは colors 引数で指定できます。
In [3]:
import numpy as np
from matplotlib import pyplot as plt

x = [1, 2, 3, 4, 5]
y1 = [1, 1, 2, 3, 5]
y2 = [0, 4, 2, 6, 8]
y3 = [1, 3, 5, 7, 9]

fig, ax = plt.subplots()
ax.stackplot(x, y1, y2, y3, colors=["r", "b", "g"])

plt.show()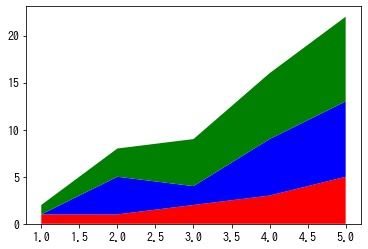
コメント