
概要
matplotlib で、animation.ArtistAnimation または animation.FuncAnimation を使用して、アニメーションするグラフを作成する方法について解説します。
animation.ArtistAnimation
使い方
animation.ArtistAnimation は予め、使用するすべてのフレームを作成してから、アニメーションを作成するためのオブジェクトです。
animation.ArtistAnimation(fig, artists, *args, **kwargs)- 引数
- fig: Figure オブジェクト
- artists: Artist
- interval: 各フレームのインターバルを ms で指定する。デフォルトは 200 ms。
- repeat_delay: リピートする場合、リピートする前の遅延を ms で指定する。デフォルトは None。
- repeat: リピートするかどうか。デフォルトは True。
- bilit: blitting を使用して描画を高速化するかどうか。デフォルトは False。
matplotlib では、線や点など描画されるアイテムは Artist といいます。まず、各フレームを構成する Artist の一覧を作成します。
[[フレーム1を構成する Artist 一覧],
 [フレーム2を構成する Artist 一覧],
 ...]
例えば、折れ線グラフを作成する Axes.plot() は、返り値として [lines.Line2D] を返します。これが1フレームを構成する Artist になります。
import matplotlib.pyplot as plt
import numpy as np
from matplotlib.animation import ArtistAnimation

x = np.linspace(0, np.pi * 4, 100)

fig, ax = plt.subplots()

frames = []  # 各フレームを構成する Artist 一覧

# フレームごとの Artist を作成する。
for delta in np.linspace(0, np.pi, 30):
    y = np.sin(x + delta)

    # 折れ線グラフを作成する。
    artists = ax.plot(x, y, c="b")

    # このフレームの Artist 一覧を追加する。
    frames.append(artists)

# アニメーションを作成する。
ani = ArtistAnimation(fig, frames, interval=200)

# gif 画像として保存する。
ani.save("animation.gif", writer="pillow")
plt.close()
JupyterLab で表示する場合
ani.to_jshtml() の返り値を IPython.display.HTML() に渡すことで、Notebook 上にインラインでアニメーションが表示できます。
import matplotlib.pyplot as plt
import numpy as np
from IPython.display import HTML
from matplotlib.animation import ArtistAnimation

x = np.linspace(0, np.pi * 4, 100)

fig, ax = plt.subplots(facecolor="w")

frames = []  # 各フレームを構成する Artist 一覧

# フレームごとの Artist を作成する。
for delta in np.linspace(0, np.pi, 30):
    y = np.sin(x + delta)

    # 折れ線グラフを作成する。
    artists = ax.plot(x, y, c="b")

    # このフレームの Artist 一覧を追加する。
    frames.append(artists)

# アニメーションを作成する。
ani = ArtistAnimation(fig, frames, interval=200)
HTML(ani.to_jshtml())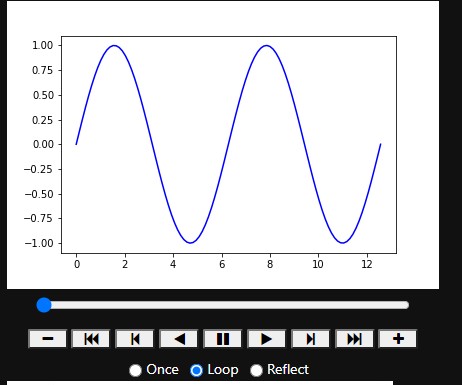
複数の Axes がある場合
複数の Axes がある場合、各フレームで表示する Artist は折れ線2つなので、以下のようになります。
artists = [[lines.Line2D, lines.Line2D],
           [lines.Line2D, lines.Line2D],
...]import matplotlib.pyplot as plt
import numpy as np
from matplotlib.animation import ArtistAnimation
x = np.linspace(0, np.pi * 4, 100)
fig, [ax1, ax2] = plt.subplots(1, 2, figsize=(8, 4))
frames = [] # 各フレームを構成する Artist 一覧
for delta in np.linspace(0, np.pi, 30):
y1 = np.sin(x + delta)
y2 = np.cos(x + delta)
artists1 = ax1.plot(x, y1, c="b")
artists2 = ax2.plot(x, y2, c="g")
# このフレームを構成する Artist を1つにまとめる。
frame = artists1 + artists2
frames.append(frame)
# アニメーションを作成する。
anim = ArtistAnimation(fig, frames, interval=500)
# gif 画像として保存する。
anim.save("animation2.gif", writer="pillow")
plt.close()
animation.FuncAnimation
予め各フレームを作成するのではなく、リアルタイムにアニメーションのフレームを作成する場合は、animation.FuncAnimation を使用します。
- 引数
funcに1フレームの図を作成する関数を渡します。この関数は第1引数に現在のフレーム番号が渡されます。 funcが追加の引数をとる場合、FuncAnimationオブジェクトを作成する際に、フレームごとに異なるデータはframes引数、すべてのフレームで同じデータはfargs引数で指定します。- アニメーションにする際に1フレームあたりの時間は
intervalにミリ秒で指定します。例えば、interval=500とした場合、2fps のアニメーションになります。
animation.FuncAnimation(fig, func, frames=None, init_func=None, fargs=None, save_count=None, **kwargs)- 引数
- fig: Figure オブジェクト
- func: 各フレームを生成する関数
- frames: 各フレームのデータ
- int: 現在のフレーム数が
funcに渡される。 - iterable, generator: 各要素が
funcに渡される。
- int: 現在のフレーム数が
- init_func: 各フレームを初期化する関数
- fargs: func に渡す引数。
- save_count: キャッシュするフレーム数
- interval: 各フレームのインターバルを ms で指定する。デフォルトは 200 ms。
- repeat_delay: リピートする場合、リピートする前の遅延を ms で指定する。デフォルトは None。
- repeat: リピートするかどうか。デフォルトは True。
- bilit: blitting を使用して描画を高速化するかどうか。デフォルトは False。
import matplotlib.pyplot as plt
import numpy as np
from matplotlib.animation import FuncAnimation


def plot(frame_no):
    # 前のフレームの描画をクリアする。
    ax.cla()

    # 折れ線を作成する。
    x = np.linspace(0, np.pi * 4, 100)
    y = np.sin(x + frame_no)
    ax.plot(x, y, c="b")


# アニメーションを作成する。
fig, ax = plt.subplots()
anim = FuncAnimation(fig, plot, frames=30, interval=400)

# gif 画像として保存する。
anim.save("animation3.gif", writer="pillow")
plt.close()
様々なアニメーション
等高線のアニメーション
Axes.contourf() で等高線を作成した場合、その関数が返す contour.QuadContourSet オブジェクトの collections 属性に等高線を構成する Artist の一覧が入っています。
import matplotlib.pyplot as plt
import numpy as np
from matplotlib.animation import ArtistAnimation
from scipy.stats import multivariate_normal

# (x, y) の点の一覧を作成する。
x = np.linspace(-5, 5, 1000)
y = np.linspace(-5, 5, 1000)
X, Y = np.meshgrid(x, y)
XY = np.c_[np.ravel(X), np.ravel(Y)]

fig, ax = plt.subplots(figsize=(4, 4))

frames = []  # 各フレームを構成する Artist 一覧
for i in np.linspace(0, 4, 10):
    # 2次元正規分布の値を生成する。
    mean = np.array([i, i])
    sigma = np.eye(2)
    Z = multivariate_normal.pdf(x=XY, mean=mean, cov=sigma)
    Z = Z.reshape(X.shape)

    # 等高線グラフを作成する。
    im = ax.contourf(X, Y, Z, 10, cmap=plt.cm.winter)

    # 等高線を構成する Artist 一覧を追加する。
    frames.append(im.collections)

# アニメーションを作成する。
anim = ArtistAnimation(fig, frames, interval=500)

# gif 画像として保存する。
anim.save("animation4.gif", writer="pillow")
plt.close()
画像のアニメーション
指定したディレクトリ内の画像を読み込み、imshow() で連続して表示するアニメーションのサンプルです。
from pathlib import Path

import matplotlib.pyplot as plt
import numpy as np
from matplotlib.animation import FuncAnimation


def plot(img_path):
    # 前のフレームの描画をクリアする。
    ax.cla()
    img = plt.imread(img_path)
    ax.imshow(img)
    ax.set_axis_off()


img_dir = Path("images")
img_paths = img_dir.glob("*.jpg")

# アニメーションを作成する。
fig, ax = plt.subplots()
anim = FuncAnimation(fig, plot, frames=img_paths, interval=300)

# gif 画像として保存する。
anim.save("animation5.gif", writer="pillow")
plt.close()
コメント
コメント一覧 (0件)
参考になりました。
見出しと文中でいくつかArtistAnimationがFuncAnimationになっている箇所があるので直しておいたほうがよいかもです。
お返事が遅くなりすみません。
ご指摘ありがとうございます。間違っている部分を修正しました。