
概要
matplotlib の GridSpec を使用して、1つの図に様々な大きさのグラフを追加する方法について解説します。
API
- gridspec.GridSpec: グリッド
- gridspec.SubplotSpec: グリッド上で Subplot を配置する領域
- gridspec.GridSpecFromSubplotSpec: 入れ子になったグリッド
- pyplot.subplot2grid: ヘルパー関数
- Figure.add_gridspec Figure にグリッドを作成する
使い方
import matplotlib.pyplot as plt
from matplotlib.gridspec import GridSpec

fig = plt.figure()

# 1.
gs = GridSpec(3, 3)  # グリッド

# 2.
ss1 = gs.new_subplotspec((0, 0), colspan=2)  # ax1 を配置する領域
ss2 = gs.new_subplotspec((1, 0), rowspan=2, colspan=2)  # ax2 を配置する領域
ss3 = gs.new_subplotspec((0, 2), rowspan=3)  # ax3 を配置する領域

# 3.
ax1 = plt.subplot(ss1)
ax2 = plt.subplot(ss2)
ax3 = plt.subplot(ss3)

# デバッグ用
def make_ticklabels_invisible(fig):
    """目盛りを非表示にし、Axes の真ん中にテキストを追加する。"""
    for i, ax in enumerate(fig.axes, 1):
        ax.text(0.5, 0.5, "ax{}".format(i), fontsize=20, va="center", ha="center")
        for tl in ax.get_xticklabels() + ax.get_yticklabels():
            tl.set_visible(False)


make_ticklabels_invisible(fig)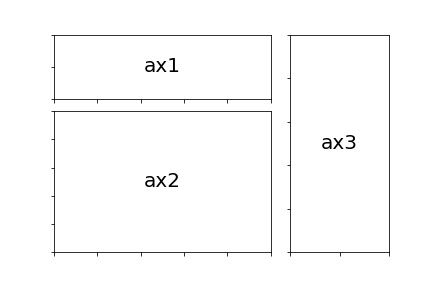
コードについて解説します。
pyplot.GridSpec(num_rows, num_cols) で GridSpec オブジェクトを作成します。
gs = plt.GridSpec(4, 3)
GridSpec.new_subplotspec((i, j), rowspan=num_rows, colspan=num_cols) でグリッド上の Subplot を配置する領域を表す SubplotSpec オブジェクトを作成します。
ss1 = gs.new_subplotspec((0, 0), colspan=2)
ss2 = gs.new_subplotspec((1, 0), rowspan=2, colspan=2)
ss3 = gs.new_subplotspec((0, 2), rowspan=3)
SubplotSpec オブジェクトを pyplot.subplot() の第1引数に渡し、その領域に Axes を作成します。
ax1 = plt.subplot(ss1)
ax2 = plt.subplot(ss2)
ax3 = plt.subplot(ss3)
GridSpec オブジェクトの indexing を使う
GridSpec は pyplot.new_subplotspec() を使う代わりに、numpy 風のインデックスの指定により、グリッド上で Subplot を配置する領域を表す SubplotSpec オブジェクトを作成できます。
import matplotlib.pyplot as plt
from matplotlib.gridspec import GridSpec

fig = plt.figure()
gs = GridSpec(3, 3)
ax1 = plt.subplot(gs[0, :2])
ax2 = plt.subplot(gs[1:, :2])
ax3 = plt.subplot(gs[:, 2])

make_ticklabels_invisible(fig)
pyplot.subplot2grid() を使う
subplot2grid() は、グリッドの形状、グリッド上で Subplot を配置する領域を引数で指定して Axes を作成できるヘルパー関数です。
import matplotlib.pyplot as plt

fig, ax = plt.subplots()
ax1 = plt.subplot2grid((3, 3), (0, 0), colspan=2)
ax2 = plt.subplot2grid((3, 3), (1, 0), rowspan=2, colspan=2)
ax3 = plt.subplot2grid((3, 3), (0, 2), rowspan=3)

make_ticklabels_invisible(fig)
余白を調整する
GridSpec の引数で余白を調整できます。
left, right, bottom, topは Figure 上に作成する GridSpec の領域を指定します。単位は Figure の左下が (0, 0)、右上が (1, 1) である座標系です。wspace, hspaceはそれぞれ Subplot 間の水平方向、垂直方向の余白を指定します。単位は wspace の場合は Axes の幅の平均に対する割合、hspace の場合は Axes の高さの平均に対する割合です。

import matplotlib.pyplot as plt
from matplotlib.gridspec import GridSpec

fig, ax = plt.subplots()
gs = GridSpec(3, 3, left=0.05, right=0.95, bottom=0.1, top=0.9, wspace=0.4, hspace=0.4)
ax1 = plt.subplot(gs[0, :2])
ax2 = plt.subplot(gs[1:, :2])
ax3 = plt.subplot(gs[:, 2:])

make_ticklabels_invisible(fig)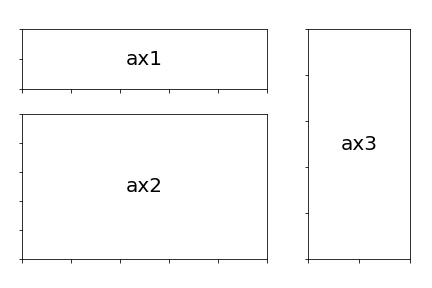
グリッドを入れ子にして作成する
GridSpecFromSubplotSpec を使うことで入れ子のグリッドを作成して、その領域に Axes を作成できます。
- GridSpec オブジェクトを作成します。
- GridSpec の指定した領域に GridSpecFromSubplotSpec オブジェクトを作成します。
- GridSpecFromSubplotSpec の指定した領域に Axes オブジェクトを作成します。

import matplotlib.pyplot as plt
from matplotlib.gridspec import GridSpec, GridSpecFromSubplotSpec

fig = plt.figure()
# 1
gs0 = GridSpec(1, 2)
# 2
gs00 = GridSpecFromSubplotSpec(3, 3, subplot_spec=gs0[0])
gs01 = GridSpecFromSubplotSpec(3, 3, subplot_spec=gs0[1])
# 3
ax1 = plt.subplot(gs00[:-1, :])
ax2 = plt.subplot(gs00[-1, :-1])
ax3 = plt.subplot(gs00[-1, -1])
ax4 = plt.subplot(gs01[:, :-1])
ax5 = plt.subplot(gs01[:-1, -1])
ax6 = plt.subplot(gs01[-1, -1])

make_ticklabels_invisible(fig)
plt.show()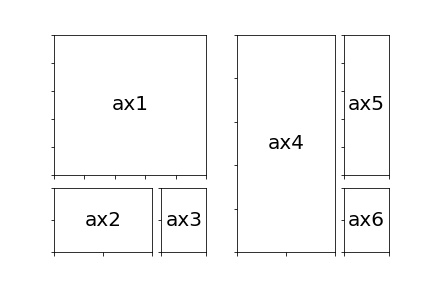
GridSpec の各セルの大きさを変更する
GridSpec の width_ratios, height_ratios でそれぞれグリッドを作成した際の列、行の長さの比率を指定できます。

import matplotlib.pyplot as plt
from matplotlib.gridspec import GridSpec

fig = plt.figure()
gs = GridSpec(2, 2, width_ratios=[1, 2], height_ratios=[4, 1])
ax1 = plt.subplot(gs[0])
ax2 = plt.subplot(gs[1])
ax3 = plt.subplot(gs[2])
ax4 = plt.subplot(gs[3])

make_ticklabels_invisible(fig)
plt.show()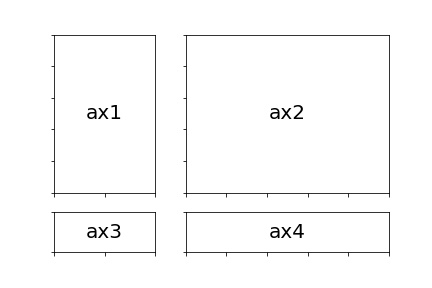
コメント