
目次
概要
matplotlib の fill_between、fill_betweenx で関数の区間を塗りつぶす、fill でポリゴンの内部を塗りつぶす方法について解説します。
公式リファレンス
関数
- pyplot.fill_between: 2つの関数の y 軸方向の区間を塗りつぶす
- Axes.fill_between: 2つの関数の y 軸方向の区間を塗りつぶす
- pyplot.fill_betweenx: 2つの関数の x 軸方向の区間を塗りつぶす
- Axes.fill_betweenx: 2つの関数の x 軸方向の区間を塗りつぶす
- pyplot.fill: ポリゴンの内部を塗りつぶす
- Axes.fill: ポリゴンの内部を塗りつぶす
サンプル
fill_between – 2つの関数の y 軸方向の区間を塗りつぶす
In [1]:
import numpy as np
from matplotlib import pyplot as plt

x = np.linspace(0, 10, 1000)
y1 = np.sin(x)
y2 = np.cos(x)

fig, ax = plt.subplots()
ax.plot(x, y1, "k")
ax.plot(x, y2, "k")
ax.fill_between(x, y1, y2)

plt.show()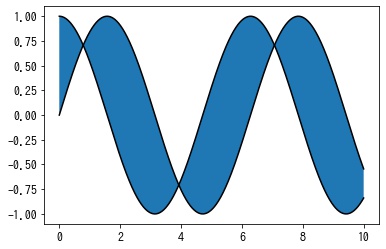
マスクで塗りつぶす範囲を限定する
In [2]:
fig, ax = plt.subplots()
ax.plot(x, y1, "k")
ax.plot(x, y2, "k")
ax.fill_between(x, y1, y2, where=x < 5)

plt.show()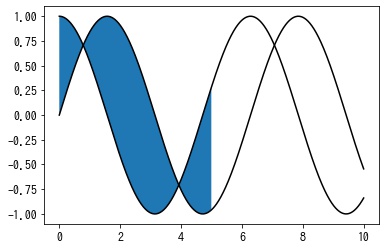
ポリゴンの設定
色など設定したい場合は collections.PolyCollection のパラメータで指定できます。
In [3]:
fig, ax = plt.subplots()
ax.plot(x, y1, "k")
ax.plot(x, y2, "k")
ax.fill_between(x, y1, y2, fc="w", hatch="//")

plt.show()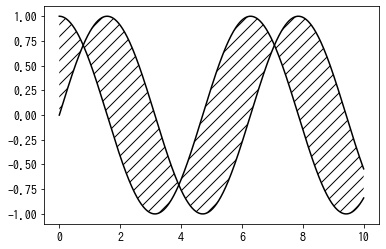
2つの折れ線の点の間隔が異なる場合
2つの折れ線の点の間隔が異なる場合は fill_between() の代わりに fill() を使い、以下のようにします。
In [4]:
x1 = np.linspace(0, 10, 1000)
y1 = np.sin(x1)

x2 = np.linspace(0, 10, 100)
y2 = np.cos(x2)
print(x1.shape, x2.shape)

fig, ax = plt.subplots()
ax.plot(x1, y1, "k")
ax.plot(x2, y2, "k")
ax.fill(np.append(x1, x2[::-1]), np.append(y1, y2[::-1]))

plt.show()
(1000,) (100,)

fill_betweenx – 2つの関数の x 軸方向の区間を塗りつぶす
In [5]:
y = np.linspace(0, 4 * np.pi, 100)
x1 = np.sin(y)
x2 = np.cos(y)

fig, ax = plt.subplots(figsize=(4, 6))
ax.plot(x1, y, c="k")
ax.plot(x2, y, c="k")
ax.fill_betweenx(y, x1, x2)

plt.show()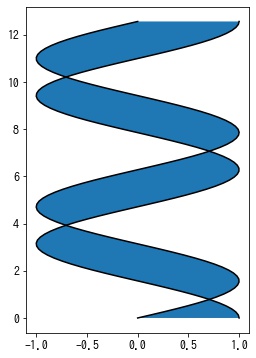
マスクで塗りつぶす範囲を限定する
In [6]:
fig, ax = plt.subplots(figsize=(4, 6))
ax.plot(x1, y, c="k")
ax.plot(x2, y, c="k")
ax.fill_betweenx(y, x1, x2, where=y < 5)

plt.show()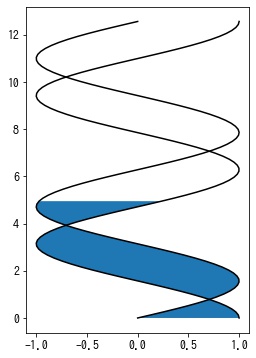
ポリゴンの設定
色など設定したい場合は collections.PolyCollection のパラメータで指定できます。
In [7]:
fig, ax = plt.subplots(figsize=(4, 6))
ax.plot(x1, y, c="k")
ax.plot(x2, y, c="k")
ax.fill_betweenx(y, x1, x2, fc="w", hatch="//")

plt.show()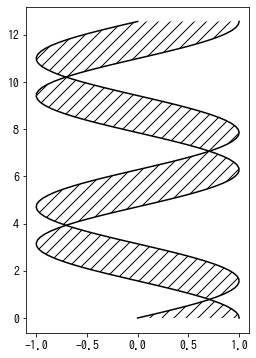
fill – ポリゴンの内部を塗りつぶす
ax.fill(x, y)
ax.fill(x, y, color)
ax.fill(x, y, x2, y2)
ax.fill(x, y, color1, x2, y2, color2)
1つのポリゴンを描画する
In [8]:
x = np.array([0, 1, 2, 1])
y = np.array([1, 2, 1, 0])

fig, ax = plt.subplots()
ax.fill(x, y)
ax.set_aspect("equal")

plt.show()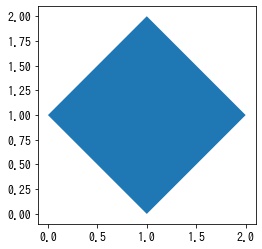
複数のポリゴンを一度に描画する
In [9]:
x1 = np.array([0, 1, 2, 1])
x2 = x1 + 1
y = np.array([1, 2, 1, 0])

fig, ax = plt.subplots()
ax.fill(x1, y, x2, y)
ax.set_aspect("equal")

plt.show()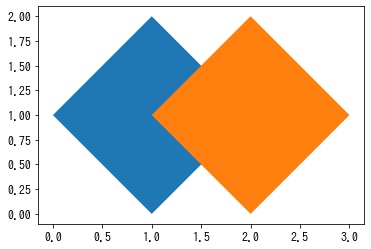
色を指定する
In [10]:
x = np.array([0, 1, 2, 1])
y = np.array([1, 2, 1, 0])

fig, ax = plt.subplots()
ax.fill(x, y, color="r")
ax.set_aspect("equal")

plt.show()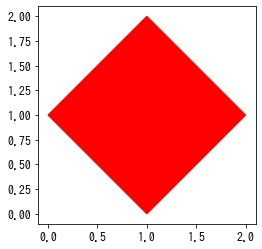
In [11]:
x1 = np.array([0, 1, 2, 1])
x2 = x1 + 1
y = np.array([1, 2, 1, 0])

fig, ax = plt.subplots()
ax.fill(x1, y, "orange", x2, y, "red")
ax.set_aspect("equal")

plt.show()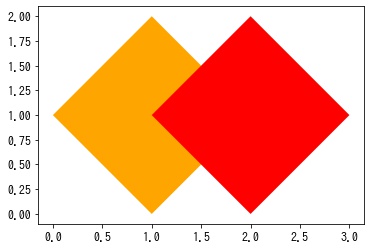
ポリゴンの設定
色など設定したい場合は patches.Polygon のパラメータで指定できます。
In [12]:
x = np.array([0, 1, 2, 1])
y = np.array([1, 2, 1, 0])

fig, ax = plt.subplots()
ax.fill(x, y, edgecolor="k", fc="w", hatch="o")
ax.set_aspect("equal")

plt.show()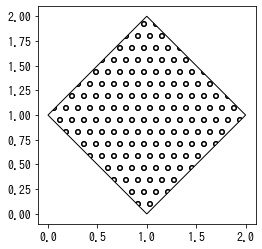
コメント