
目次
概要
matplotlib でグラフの描画範囲を設定、取得する方向について解説します。
公式リファレンス
- pyplot.xlim: x 軸方向の表示範囲を取得または指定する
- Axes.set_xlim: x 軸方向の表示範囲を指定する
- pyplot.ylim: y 軸方向の表示範囲を取得または指定する
- Axes.set_ylim: y 軸方向の表示範囲を指定する
- Axes.get_xlim: x 軸方向の表示範囲を取得する
- Axes.get_ylim: y 軸方向の表示範囲を取得する
表示範囲を指定する
In [1]:
import numpy as np
from matplotlib import pyplot as plt

x = np.linspace(0, 10, 100)
y = np.sin(x)

fig, ax = plt.subplots()
ax.plot(x, y)
ax.set_xlim(0, np.pi * 2)
ax.set_ylim(-2, 2)
ax.grid()

plt.show()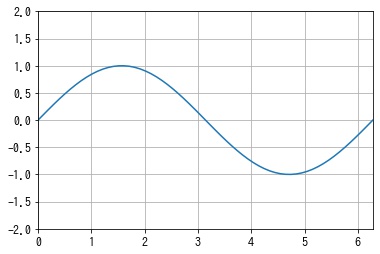
表示範囲を取得する
In [2]:
x = np.linspace(0, 10, 1000)
y = np.sin(x)

fig, ax = plt.subplots()
ax.plot(x, y)
ax.grid()

plt.show()

# 描画範囲を取得する。
xmin, xmax = ax.get_xlim()
ymin, ymax = ax.get_ylim()
print(f"x: [{xmin}, {xmax}], y: [{ymin}, {ymax}]")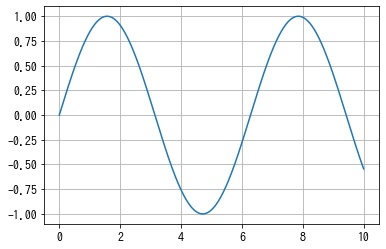
x: [-0.5, 10.5], y: [-1.0999971452300779, 1.099999549246729]
コメント