
概要
matplotlib の pyplot.subplots(), Figure.add_subplots() を使用して、グリッド上の Axes を作成する方法について解説します。
subplot
matplotlib において、Figure の中に複数の Axes がある場合、それらを Subplot といいます。
グリッド状に配置された subplot を作成する
Figure をグリッド上に分割して、すべてのセルに Axes を作成する pyplot.subplots() と、Figure をグリッド上に分割して1つずつ Axes を追加する Figure.subplot() があります。
pyplot.subplots
pyplot.subplot() は、現在の Figure を (nrows, ncols) に等分割した場合のインデックスが index のセルに Axes を1つ作成します。
分割した各セルは行優先順で 1 から nrows * ncols のインデックスが振られています。
ax = subplot(nrows=1, ncols=1, index=1)
import numpy as np
import matplotlib.pyplot as plt

x = np.linspace(0, 10, 100)
y1 = np.sin(x)
y2 = np.cos(x)

# 2x2 にグリッド上に分割した場合の index=1 の位置に Axes を作成する。
plt.subplot(2, 2, 1)
plt.plot(x, y1)

# 2x2 にグリッド上に分割した場合の index=4 の位置に Axes を作成する。
plt.subplot(2, 2, 4)
plt.plot(x, y2)

plt.show()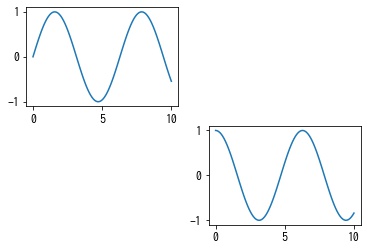
途中で分割を変更した場合は、以前に作成した axes は削除されてしまうので注意してください。
ax1 = add_subplot(2, 2, 1)
ax2 = add_subplot(1, 2, 2)  # 分割数を変更したので、ax1 は削除された。
nrows, ncols, index がすべて一桁であることが保証される (nrow * ncols < 10) 場合は、nrows, ncols, index を3桁の整数を使って引数1つで指定できます。
- 例:
nrows=2, ncols=2, index=1の場合は221
import numpy as np
import matplotlib.pyplot as plt

x = np.linspace(0, 10, 100)
y1 = np.sin(x)
y2 = np.cos(x)

# plt.subplot(2, 2, 1) と同じ
plt.subplot(221)
plt.plot(x, y1)

# plt.subplot(2, 2, 4) と同じ
plt.subplot(224)
plt.plot(x, y2)

plt.show()
Figure.add_subplots
Figure クラスの Figure.add_subplot() でも同じことができます。
import numpy as np
from matplotlib import pyplot as plt

x = np.linspace(0, 10, 100)
y1 = np.sin(x)
y2 = np.cos(x)

fig = plt.figure()

# fig を 2x2 にグリッド上に分割した場合の index=1 の位置に Axes を作成する。
ax1 = fig.add_subplot(2, 2, 1)
ax1.plot(x, y1)

# fig を 2x2 にグリッド上に分割した場合の index=4 の位置に Axes を作成する。
ax2 = fig.add_subplot(2, 2, 4)
ax2.plot(x, y1)

plt.show()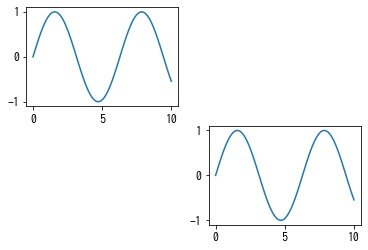
pyplot.subplots
pyplot.subplots は、現在の Figure を (nrows, ncols) に等分割し、各セルに Axes を一度に作成して、numpy 配列で返します。
fig, axes = subplots(nrows=1, ncols=1)
import numpy as np
from matplotlib import pyplot as plt

x = np.linspace(0, 10, 100)
y1 = np.sin(x)
y2 = np.cos(x)

fig, ax = plt.subplots(2, 1)
ax[0].plot(x, y1)
ax[1].plot(x, y2)

plt.show()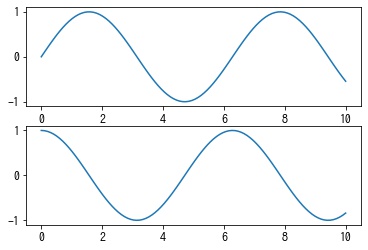
返り値 axes は nrows, ncols の指定によって形状が異なります。
nrows=n, ncols=1の場合: 各要素が Axes オブジェクトの(n,)の numpy 配列nrows=1, ncols=nの場合: 各要素が Axes オブジェクトの(n,)の numpy 配列nrows=n, ncols=mの場合: 各要素が Axes オブジェクトの(n, m)の numpy 配列nrows=1, ncols=1の場合: 単一の Axes オブジェクトnrows, ncolsを指定しない場合、デフォルトはnrows=1, ncols=1なので、単一の Axes オブジェクトを返します
fig, ax = plt.subplots(3, 1)
print(ax.shape)  # (3,)

fig, ax = plt.subplots(1, 3)
print(ax.shape)  # (3,)

fig, ax = plt.subplots(3, 3)
print(ax.shape)  # (3, 3)

fig, ax = plt.subplots(1, 1)
print(type(ax))  # <class 'matplotlib.axes._subplots.AxesSubplot'>

fig, ax = plt.subplots()
print(type(ax))  # <class 'matplotlib.axes._subplots.AxesSubplot'>
Figure.subplots
Figure.subplots() でも同じことができます。
import numpy as np
from matplotlib import pyplot as plt

x = np.linspace(0, 10, 100)
y1 = np.sin(x)
y2 = np.cos(x)

fig = plt.figure()

ax = fig.subplots(2, 1)
ax[0].plot(x, y1)
ax[1].plot(x, y2)

plt.show()
Axes のマージンを調整する
pyplot.subplots_adjust
目盛りのラベルなどが重ならないように Axes のマージンを調整するには、pyplot.subplots_adjust() で行います。
| 引数 | 概要 | デフォルト値 | 単位 |
|---|---|---|---|
| left | Figure に配置されている subplots の左端 | 0.125 | Figure の左下を (0, 0)、右上を (1, 1) とした座標系 |
| right | Figure に配置されている subplots の右端 | 0.9 | Figure の左下を (0, 0)、右上を (1, 1) とした座標系 |
| bottom | Figure に配置されている subplots の下端 | 0.1 | Figure の左下を (0, 0)、右上を (1, 1) とした座標系 |
| top | Figure に配置されている subplots の上端 | 0.9 | Figure の左下を (0, 0)、右上を (1, 1) とした座標系 |
| wspace | subplot 間の水平方向の隙間 | 0.2 | すべての subplot の幅の平均に対する割合 |
| hspace | subplot 間の垂直方向の隙間 | 0.2 | すべての subplot の高さの平均に対する割合 |

from matplotlib import pyplot as plt

fig = plt.figure(figsize=(6, 6))
fig.subplots_adjust(left=0.2, bottom=0.2, right=0.8, top=0.8, wspace=0.5, hspace=0.5)

for i in range(4):
    ax = fig.add_subplot(2, 2, i + 1)
    ax.text(0.5, 0.5, f"axes[{i // 2}, {i % 2}]", fontsize=20, ha="center", va="center")

plt.show()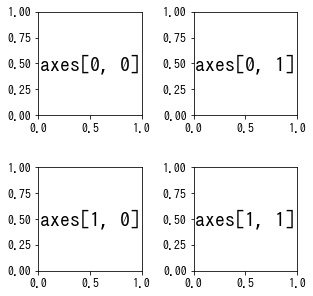
pyplot.tight_layout
目盛りのラベルなどが重ならないように Axes のマージンを調整するには、pyplot.subplots_adjust() で行います。
from matplotlib import pyplot as plt

fig = plt.figure(figsize=(6, 6))
for i in range(4):
    ax = fig.add_subplot(2, 2, i + 1)
    ax.text(0.5, 0.5, f"axes[{i // 2}, {i % 2}]", fontsize=20, ha="center", va="center")
fig.tight_layout()

plt.show()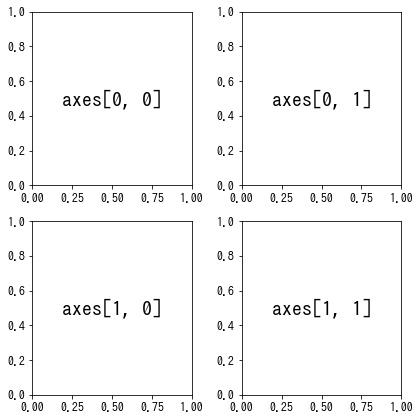
コメント