
目次
概要
Axes オブジェクトの設定可能なパラメータについて解説します。
x 軸、y 軸のアスペクト比を設定する
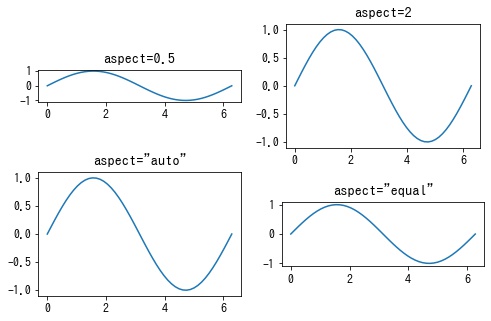
aspect で y 軸に対する x 軸のスケールを指定できます。
- float: y 軸のスケールに対して、x 軸のスケールをいくつにするか。
"equal": x 軸と y 軸は同じスケールになります。"auto": 描画領域にちょうど収まるようにアスペクト比を調整します。
In [1]:
import numpy as np
from matplotlib import pyplot as plt

x = np.linspace(0, np.pi * 2)
y = np.sin(x)

fig = plt.figure()
ax = fig.add_subplot(aspect=1)
ax.plot(x, y)

plt.show()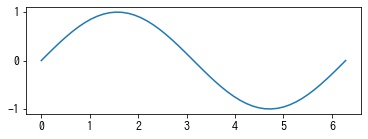
表示の前後関係を設定する
axisbelow で Axes の zorder を指定できます。zorder が大きい Artist が手前に表示されます。
| True | False | “line” | |
|---|---|---|---|
| Axes | 0.5 | 1.5 | 2.5 |
| Patch, PatchCollectio | 1 | 1 | 1 |
| Line2D, LineCollection | 2 | 2 | 2 |
| Text | 3 | 3 | 3 |
また zorder で Axes の zorder だけを指定することもできます。

背景色を設定する
facecolor で Axes の背景色を指定できます。
In [2]:
import numpy as np
from matplotlib import pyplot as plt

x = np.linspace(0, np.pi * 2)
y = np.sin(x)

fig = plt.figure()
ax = fig.add_subplot(facecolor="lightgray")
ax.plot(x, y)

plt.show()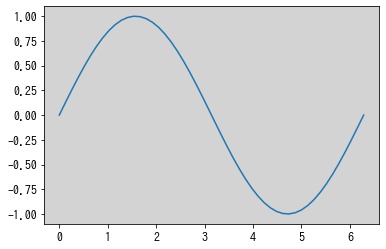
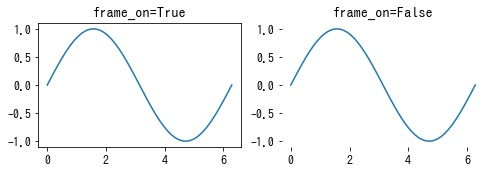
枠を付けるかどうかを設定する
frame_on で Axes に枠をつけるかどうかを指定できます。
タイトルを設定する
title で Axes のタイトルを指定できます。
In [3]:
import numpy as np
from matplotlib import pyplot as plt

x = np.linspace(0, np.pi * 2)
y = np.sin(x)

fig = plt.figure()
ax = fig.add_subplot(111, title="title")
ax.plot(x, y)

plt.show()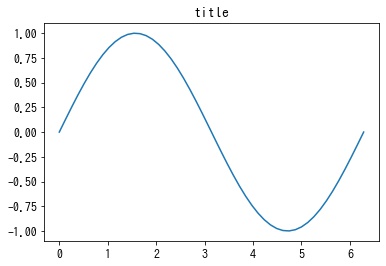
x 軸、y 軸のラベル
xlabel で x 軸のラベル、ylabel で y 軸のラベルを指定できます。
In [4]:
import numpy as np
from matplotlib import pyplot as plt

x = np.linspace(0, np.pi * 2)
y = np.sin(x)

fig = plt.figure()
ax = fig.add_subplot(111, xlabel="x", ylabel="y")
ax.plot(x, y)

plt.show()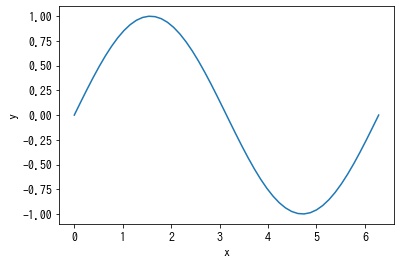
dataLim と viewLim

x 軸、y 軸のスケールを設定する
xscale, yscale で x 軸、y 軸のスケールを指定できます。指定方法は下記を参照ください。
[blogcard url=”https://pystyle.info/matplotlib-set-xy-scale”]
In [5]:
import numpy as np
from matplotlib import pyplot as plt

x = np.linspace(0.01, 1, 100)

fig = plt.figure()
ax = fig.add_subplot(111, yscale="log")
ax.plot(x, x)

plt.show()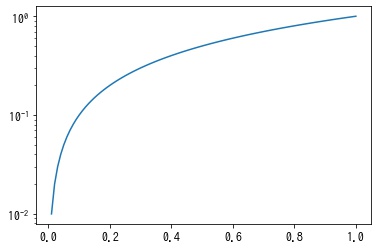
コメント